Flags in Trading Bull Flag and Bear Flag
Explain Flags in Trading Bull Flag and Bear Flag

There are two types of Flags, Bullish flag and Bearish Flag. for getting more profit we use there t flags’ patterns lets talk about
Bearish Flag Pattern
The bearish flag pattern is made by the price of an asset. When the price of an asset strongly moves down vertically . We can say that the price goes down within a selected time period. and sharply price makes low. At the lowest point, the price goes up and makes a symmetrical triangle. The same process is shown in below figure :-
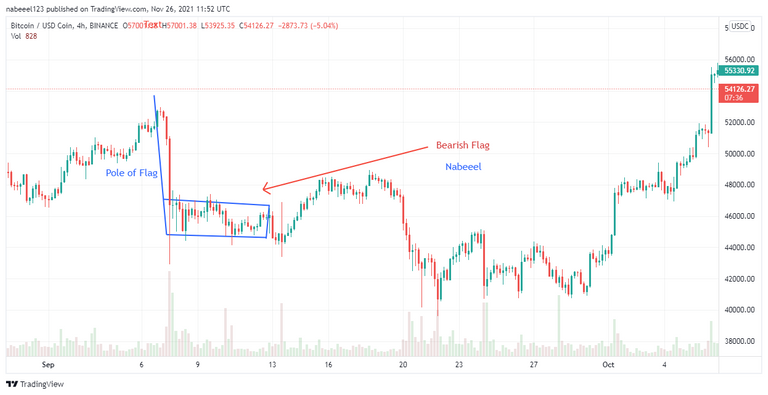
BTC/USD Bearish Flag Tradingview
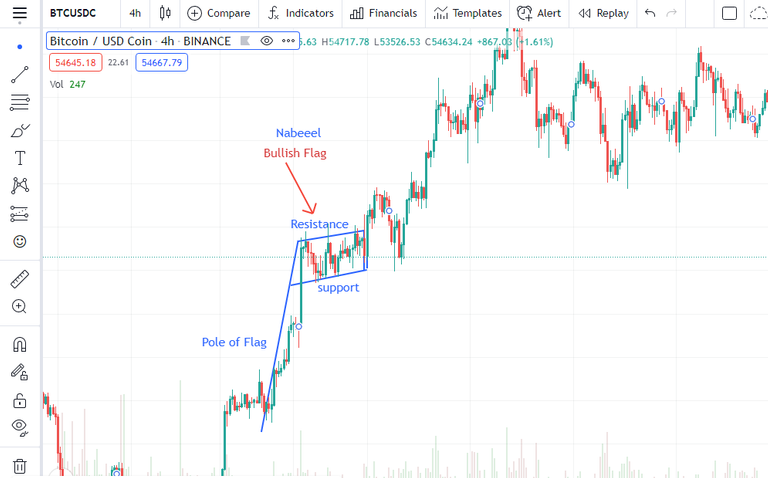
Bullish flag
Bullish flag is same but in opposite direction of Bearish Flag, when the price of an asset strongly moves up vertically and makes an angle near to 80 angle the . bull flag indicates that buyers took charge of the asset for a long time and after that, a flag shape. We can say that the price goes up within a short time period. After the price moves up the price makes high. At the highest point, candles make symmetrical triangle there is bullish flag below
TradingView
Cryptocurrency chart( Ascending Triangle, Symmetrical Triangle, Bear Flag )
Every pattern or tool and our previous experience that we use in trading to making a profit. In this lesson, there are two basic patterns, namely triangles and flags. Now we will see how we can trade on these patterns. If we make a trade with proper management then we will earn enough profit.
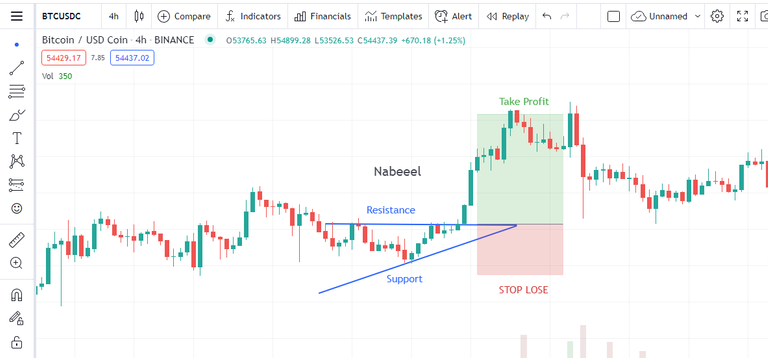
Trade with Ascending Triangle
We need to be careful before invest in any assist and we should make a triangle for in this triangle we draw two line on the chart first thing is entry of the point, so we should be careful about our entry point In ascending triangle,
The flat line on the upper side of triangle called the Resistance and the other one in the bottom side called the Support line and this line draw down to up, in the end there both line connect its make ascending triangle.
When the price breaks the resistance line then we need to place the buy.
the price crossed the resistance line, a buy entry was entered. My stop loss was set below the support line and take profit, we can earn profit by trading on these triangles.
TradingView
Trade with Symmetrical Triangle
Price is rigging of the assist, any thing could be happens when we made a Symmetrical Triangle on the chart to earning more if price can up so its fully change it could be down, so should be careful about our entry and exit point, because in . In a Symmetrical triangle, there are two resistances on both the up and downside of the triangle.
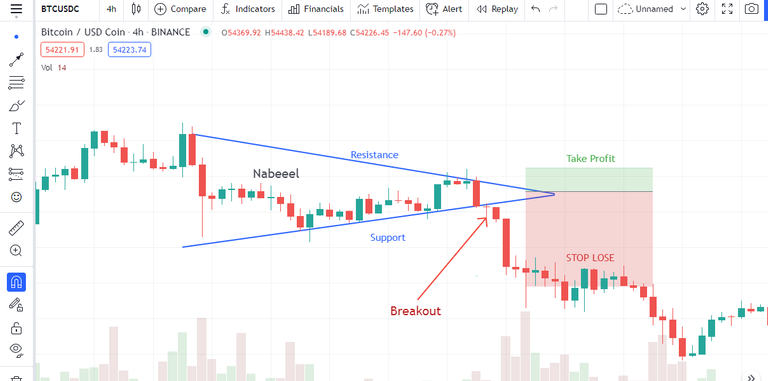
TradingView
Like the same we need to line to making a tingle one of the upper line called resistance and at the bottom like called support line as a told if price break upper Resistance line then we need to place the buy order on that moment before breakout. When price breaks the lower support line then we need to place the sell entry at just below the breakout. so avoid more lose in market.
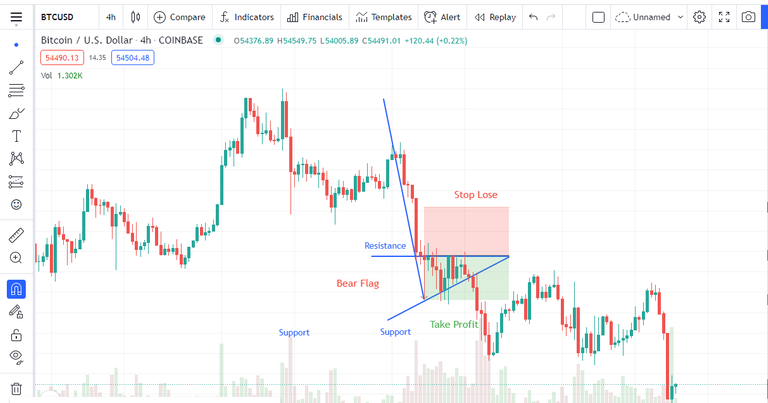
Bear Flag
This is also a Trading technique to avoiding more lose in market called Bear flag pattern, Looking at the chart below, this a bear flag pattern.The market was in ragging phase before i made analysis using the bear flag to know whether the market We use the two lines connected with the triangle to represent our support and resistance levels while trading with the bear flag.
i set the a bear flag in chart so we can get more profit with the help of bear flag technique, I believe the price will fall following a period of high. I placed my stop loss at the top of the chart, and take profit in bottom when the price hits i will take profit. This is because am shorting the market price.