Understanding about Triangles in Trading. with all Forms

What is your understanding about Triangles in Trading. all forms of triangles
One thing in disadvantage of crypto trading is reading about charts , we best know about market of crypto but a newbie can not understand the movement of the price in the chart.
photosrc
Therefor, some of Crypto trading Website provide the best tools for price analysis to catching the good profit and avoid to lose with this help. so a new traders can make their trading decisions by believing in a particular indicator. that could help them to gain best knowledge about movement of price in market.
In another way to understanding market and making good decisions This way is known as Recolonization of Patterns in Trading. New traders can predict the movements of the market by recognizing different patterns and price action in the chart of selected asset. Lets talk about it
Triangles
Analysis with Triangles can be help to read movement of price and gives good profit in trade for new traders.
WE HAVE THREE FORMS OF TRIANGLES IN TRADING
- Symmetrical triangle
- Ascending triangle
- Descending triangle
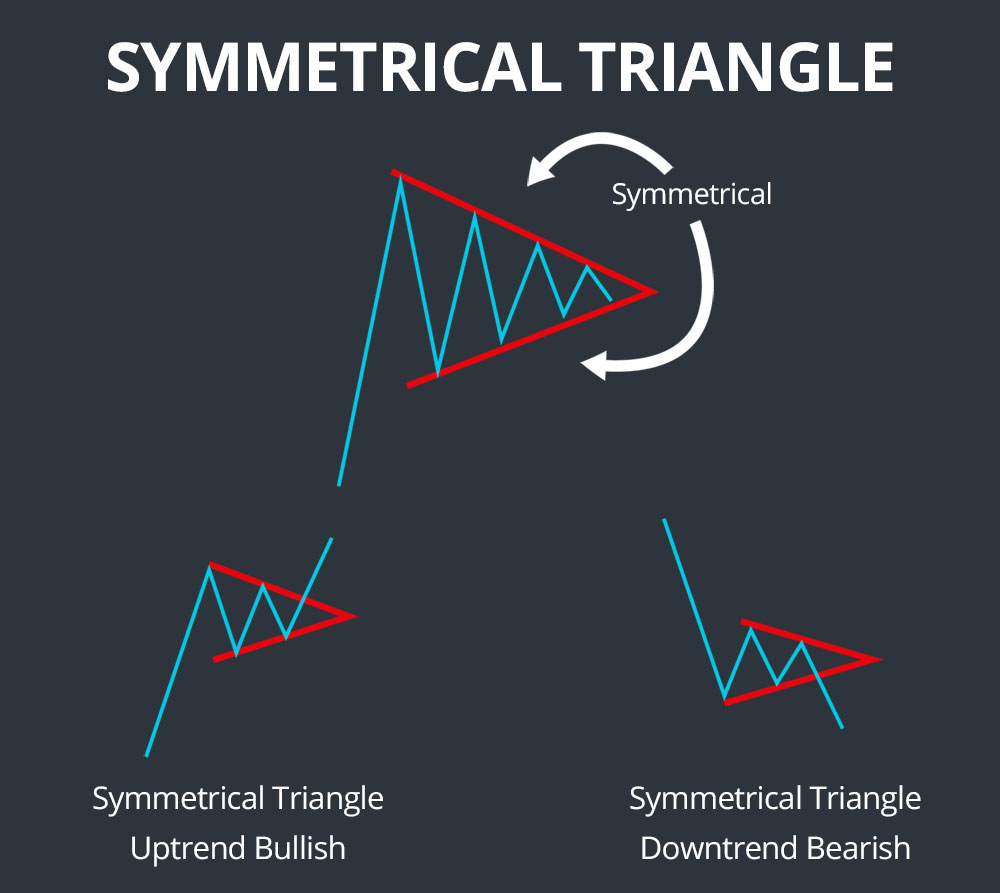
Symmetrical Triangles
A symmetrical triangle is a chart pattern characterized by two converging trend lines connecting a series of sequential peaks. like traded by two trend lines which is the upper resistance line that connected in lower highs. same lower support line connect with higher lows. This triangle is made by higher high candles are lower low candles when both lines hit together a point called symmetrical triangle, and its 50% chance to BULL or BEAR Trend in Next.
Ascending Triangles
The ascending triangle give you good profit if you are seeing this type of triangle being in crypto chart its also called bullish version of Triangles.This is a type of triangle pattern in trading, most traders use it to predict the market movement. two different trend lines, make a Bullish triangle.
One of the straight line that is placed above the chart called resistance line and the one moving upward that is placed below the chart called support line. at the end there meet that point make a triangle, when there is a breakout in the support level, this indicates that there will be a bullish movement and time to take 1 : 2 Profit.
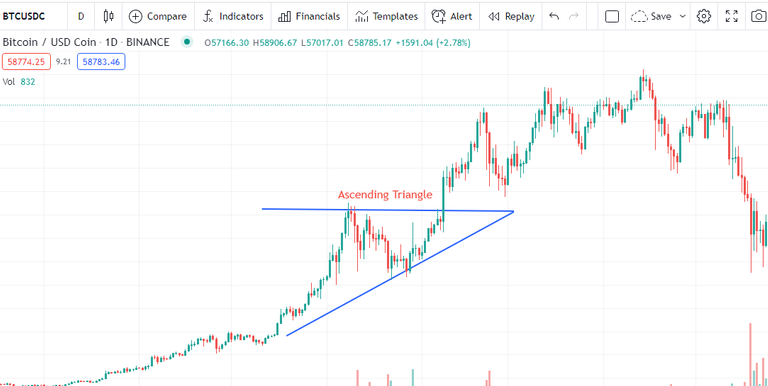
BTCUSD Chart TrendingView
Descending Triangles
New traders make this triangle on crypto chart to buying more assist, its also called the Bearish version triangle. In this triangle lower low work as a straight Support line. and the other one called the resistance line that represent by a run of lower highs, When the price breaks the support line, then the price goes down as you can see in the figure. so these two line connect its make Bearish triangle. so its time to buy more assist.
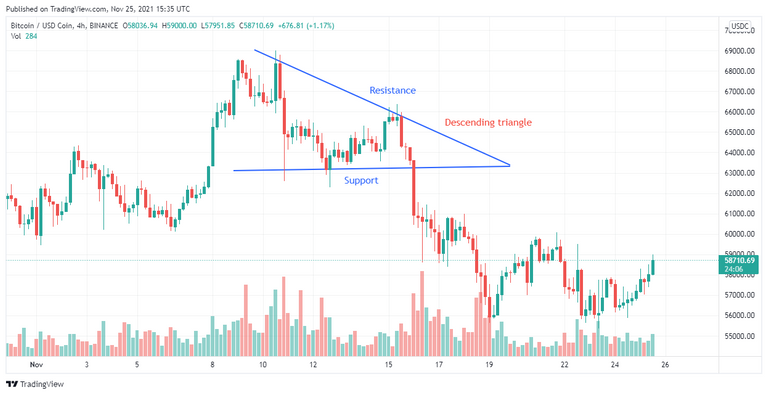
BTCUSD Chart TrendingView
Thanks for your time and be blessed