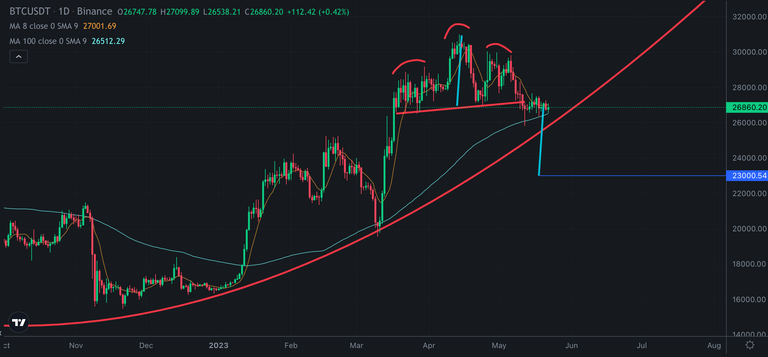
Head & Shoulders Pattern is on Bitcoin Price Chart
Bitcoin is being traded in 26500 USD level for a few days. Even It touch 100-day moving average, It could not take a support and not pumped..
There are lots of reason why Bitcoin price can not pump. I shared a few reasons of them.
Here you can see daily chart of Bitcoin and there is head & shoulders pattern on Bitcoin price chart. The goal of this pattern is to reach 23000 USD..
The main point should be the goal. If Bitcoin price reaches this goal, we will be entered in bearish season..
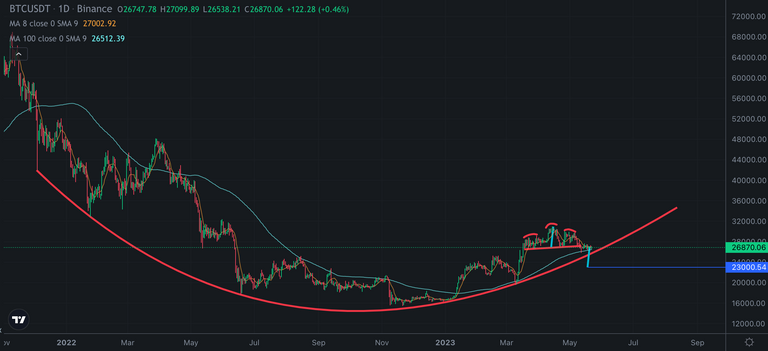
It is very dangerous level that will break down bowl pattern. It was great support bowl on Bitcoin price chart.
That will be broken down If head & shoulders pattern works...
This week will be decision week of Bitcoin to determine the direction.
There are lots of support below Bitcoin price. 100-day moving average and bowl pattern are one of the top of these supports. But head & shoulders pattern may destroy these supports..
We will see..
