Negative Divergence on Bitcoin Price Chart
Bitcoin price touched 29200 USD today. It is the highest level since June 2022. Even CZ FUD is on the table, market maker pumped Bitcoin.
Market maker is trying to make FOMO to flow investors into the market. But there is no volume. I shared a post about it and said it may be a fake pump...
There is also great negative divergence on Bitcoin price chart. Here you can see daily chart of Bitcoin. RSI Indicator's tops are decreasing, but price is increasing..
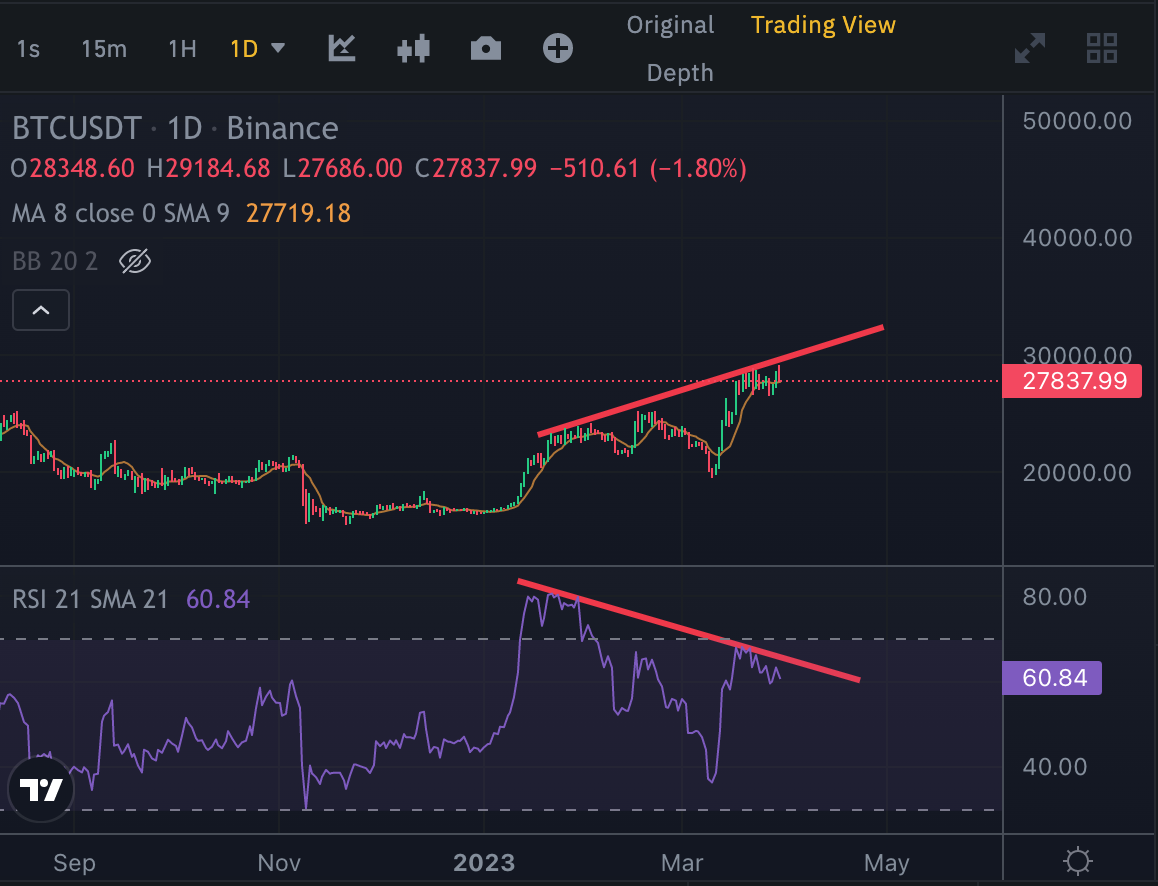
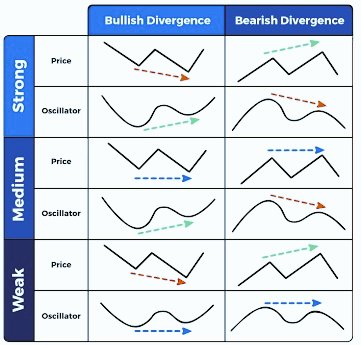
It is strong bearish divergence.. Here you can see the table of divergences. We may see a dump on Bitcoin price. MACD Indicator seems also bad.
During CZ FUD, there may not be cashflow into the market. During Bank crisis in USA and the World, FED doesn't want to flow the cash from Bank system to crypto market. They have lots of weapons to threaten.
We will see..
Posted Using LeoFinance Beta
View or trade
BEER.Hey @chorock, here is a little bit of
BEERfrom @pixresteemer for you. Enjoy it!We love your support by voting @detlev.witness on HIVE .