5 Cryptos Making Technical Analysis Moves for 3/13/2022
For this 3/13/2022, we look at cryptocurrencies making waves from Technical Analysis Perspective.
Traders of different trading timeframe philosophies would agree that it is important to gain an understanding of a currency pair's price action. This importance varies among traders, but it still remains important as traders look to buy low and sell high. Every day presents new opportunities to examine cryptocurrencies and their price movement (technical analysis).
Let’s examine the cryptocurrencies that have made the most recent technical analysis moves with various indicators. This is not an exhaustive list, this is just a selection of cryptos that have made a significant movement or have made a shift. None of the below is financial advice, you are encouraged to do your research before trading or investing in any securities. Cryptocurrency positions carry risk of loss of investment principal.
Cryptocurrency #1:EOSUSD
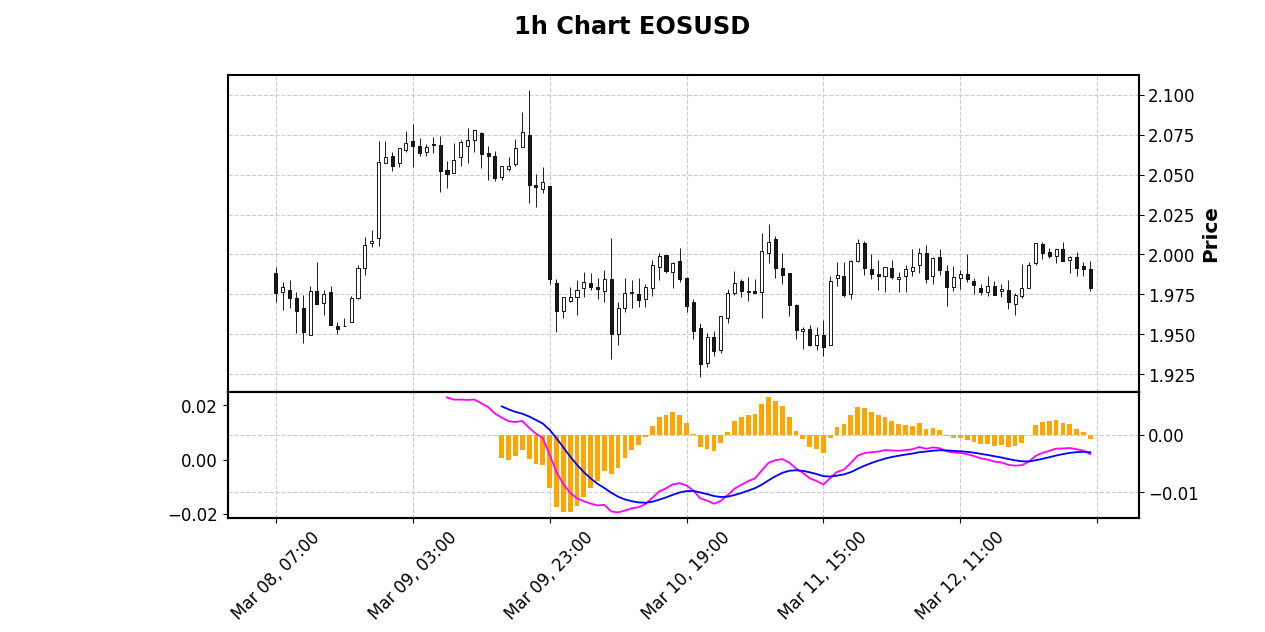
The Moving Average Convergence Divergence (MACD) indicator for EOSUSD on a hourly chart has shown a bearish signal, the signal line crossed below the MACD Line and the MACD Histogram crossed below the Zero Line in the previous trading hour on the hourly chart.

On the daily chart for EOSUSD, the Moving Average Convergence Divergence (MACD) is showing a bullish signal, the signal line crossed above the MACD Line and the MACD Histogram crossed above the Zero Line in the previous trading day on the daily chart.
Cryptocurrency #2:PAXUSD

The Moving Average Convergence Divergence (MACD) indicator for PAXUSD on a hourly chart has shown a bearish signal, the signal line crossed below the MACD Line and the MACD Histogram crossed below the Zero Line in the previous trading hour on the hourly chart.
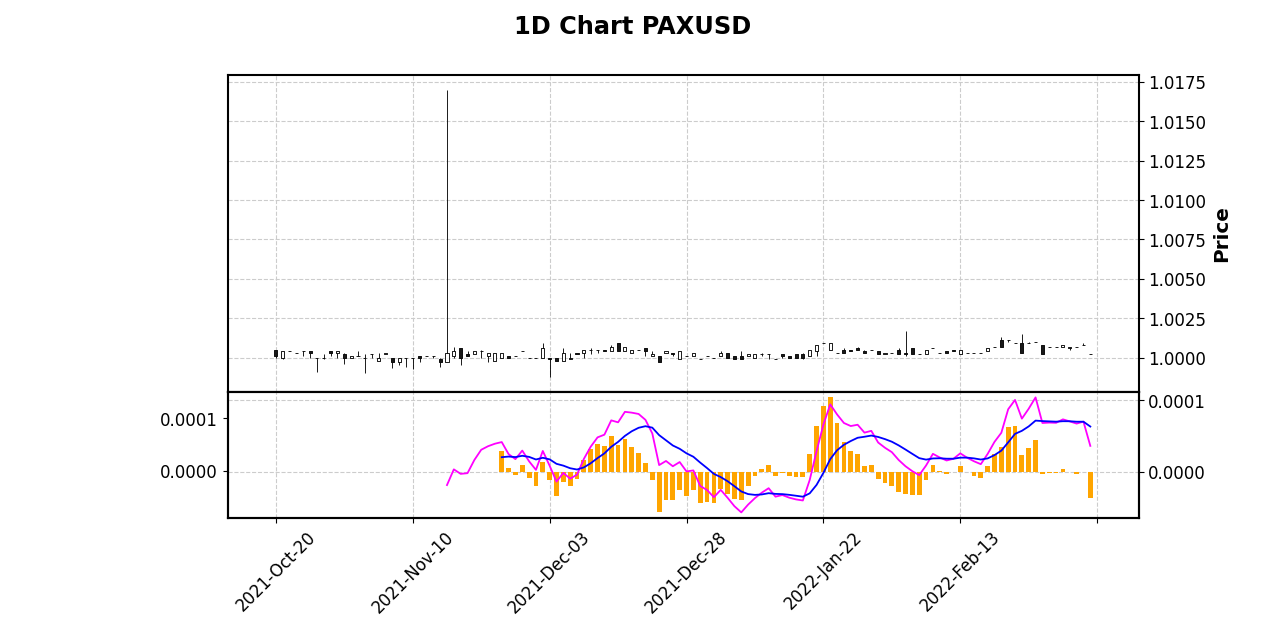
PAXUSD is appearing bearish according to the Moving Average Convergence Divergence (MACD) indicator on a daily chart with the common default settings of a 12 day Exponential Moving Average less the 26 day Exponential Moving Average with the 9 day Exponential Moving Average to be used as the Signal Line. The signal line crossed below the MACD Line and the MACD Histogram crossed below the Zero Line in the previous trading day on the daily chart.

The daily price is below the cloud (kumo), the price is below the Kijun Sen (a measure of the average of the highest high and lowest low over the last 26 periods, which happens to be days on a daily chart), and the Tenkan Sen (a measure of the average of the highest high and lowest low over the last 9 periods, which happens to be days on a daily chart) is below the Kijun Sen. All of this points to a bearish trend.
Cryptocurrency #3:TRXUSD
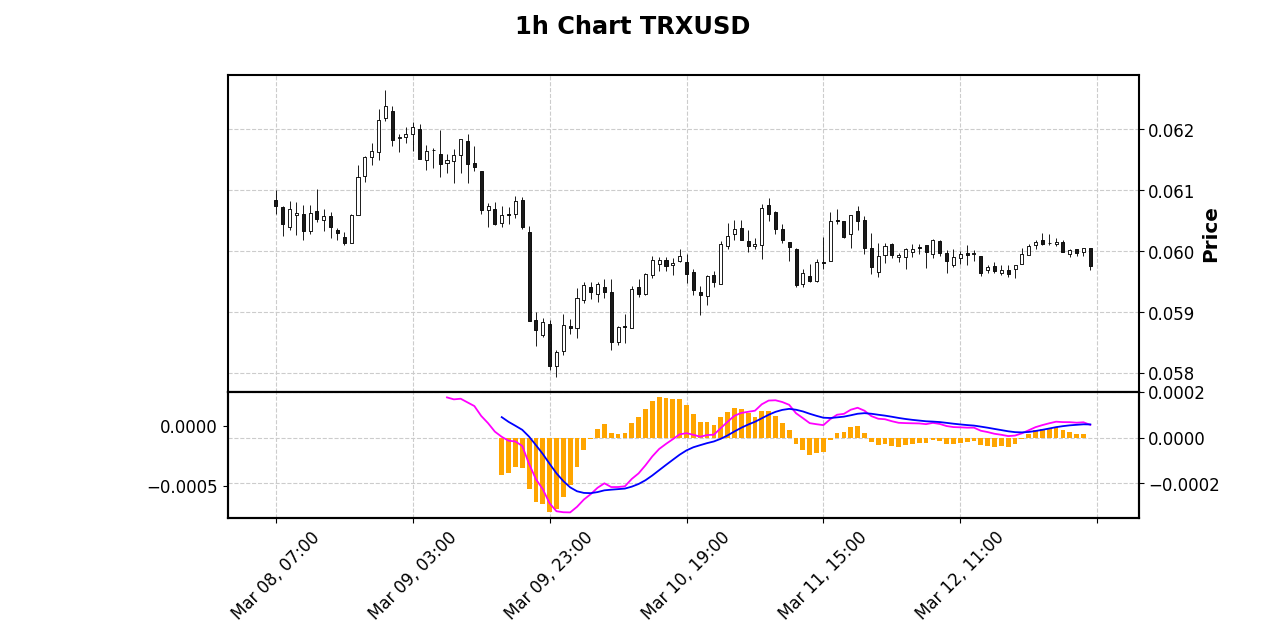
The Moving Average Convergence Divergence (MACD) indicator for TRXUSD on a hourly chart has shown a bearish signal, the signal line crossed below the MACD Line and the MACD Histogram crossed below the Zero Line in the previous trading hour on the hourly chart.
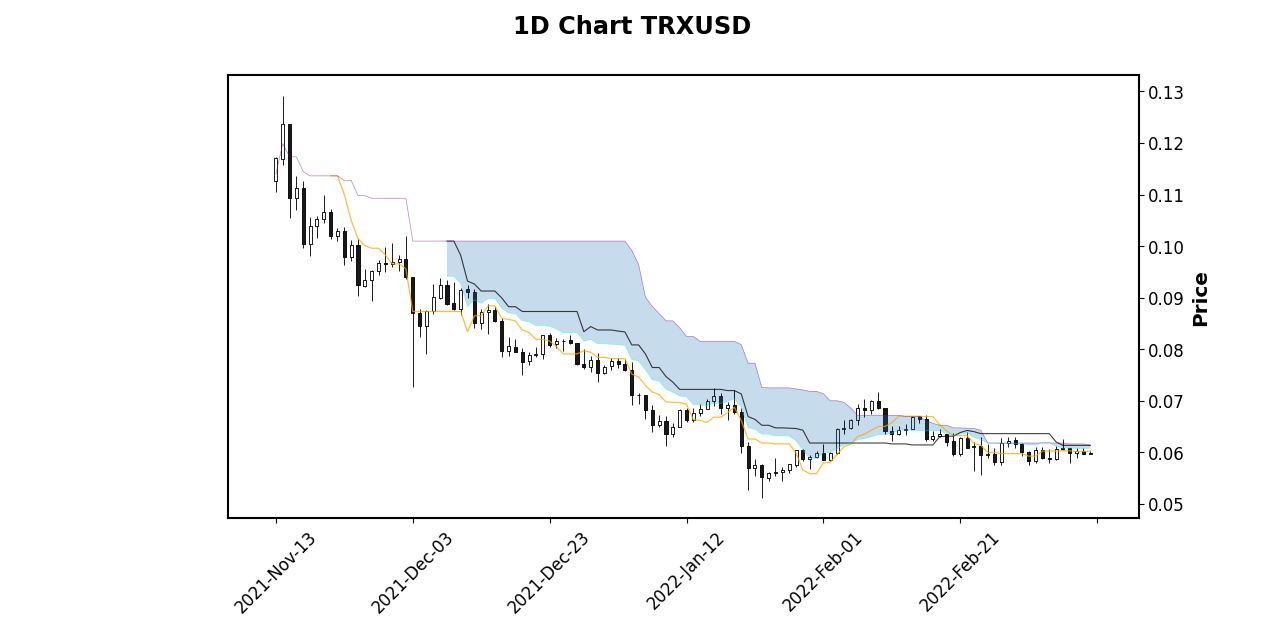
The daily price is below the cloud (kumo), the price is below the Kijun Sen (a measure of the average of the highest high and lowest low over the last 26 periods, which happens to be days on a daily chart), and the Tenkan Sen (a measure of the average of the highest high and lowest low over the last 9 periods, which happens to be days on a daily chart) is below the Kijun Sen. All of this points to a bearish trend.
Cryptocurrency #4:ZILUSD
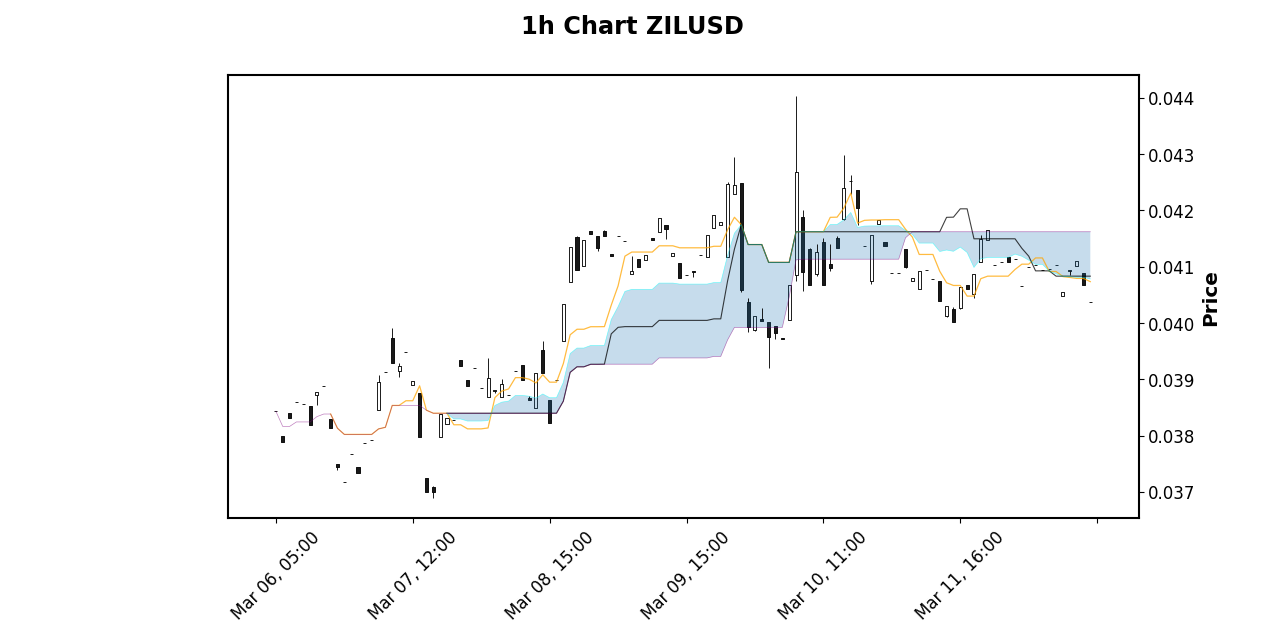
The hourly price is below the cloud (kumo), the price is below the Kijun Sen (a measure of the average of the highest high and lowest low over the last 26 periods, which happens to be hours on a hourly chart), and the Tenkan Sen (a measure of the average of the highest high and lowest low over the last 9 periods, which happens to be hours on a hourly chart) is below the Kijun Sen. All of this points to a bearish trend.
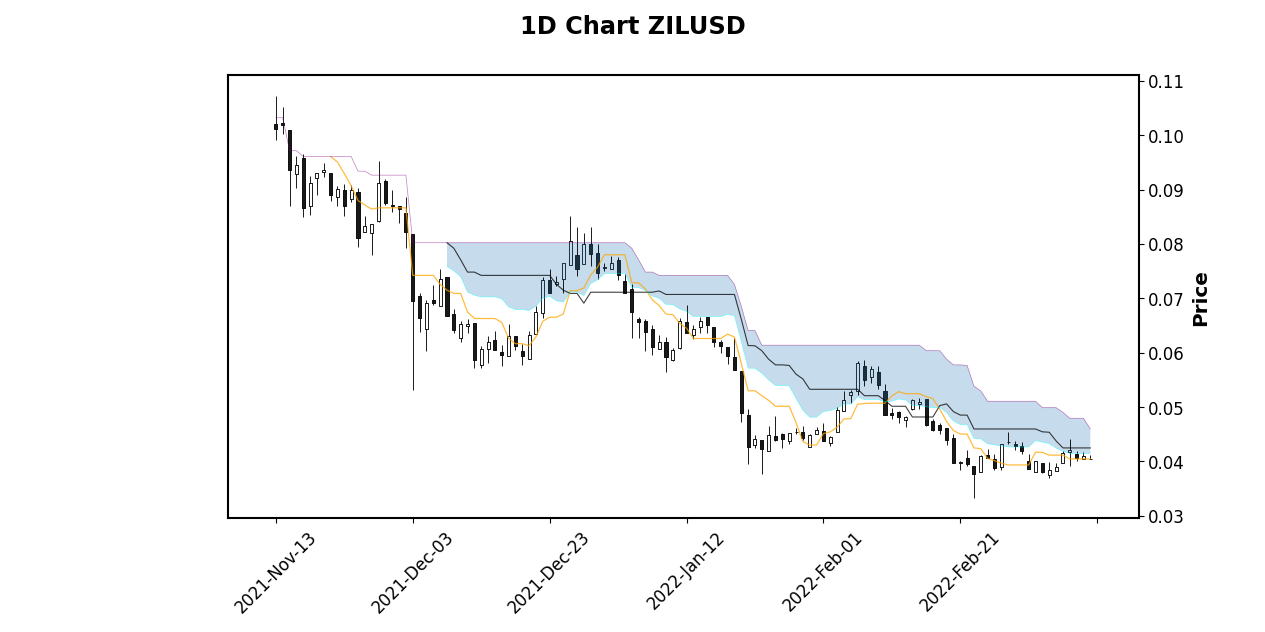
The daily price is below the cloud (kumo), the price is below the Kijun Sen (a measure of the average of the highest high and lowest low over the last 26 periods, which happens to be days on a daily chart), and the Tenkan Sen (a measure of the average of the highest high and lowest low over the last 9 periods, which happens to be days on a daily chart) is below the Kijun Sen. All of this points to a bearish trend.
0
0
0.000
0 comments