Weekly Glasnode's charts
Let's start the roundup of Glassnode's charts, quite meaty this week...
In the last week Glassnode has given us all the figures of the "capitulation" of the crypto market.
By capitulation, I mean the extreme phase of sales made by those who had bought coins in 2021 and had left them on deposit until the price drops have become psychologically untenable.
This week instead Glassnode tries to understand the dimensions that will have the bear market just started.
Premise
In its weekly low, BTC is down nearly 50% (49.9%) from the high it reached in April.
This is the second worst sell-off since 2018 to date, surpassed only by the 54% descent made in July 2021.
Such a descent is capable of changing the "sentiment" of the market in general, not only at the level of speculative traders.
Moreover, this descent, because of its depth, is different from the very strong corrections that occurred in the bull markets of 2017 and 2021, which occurred in a downward range between 20% and 40%.
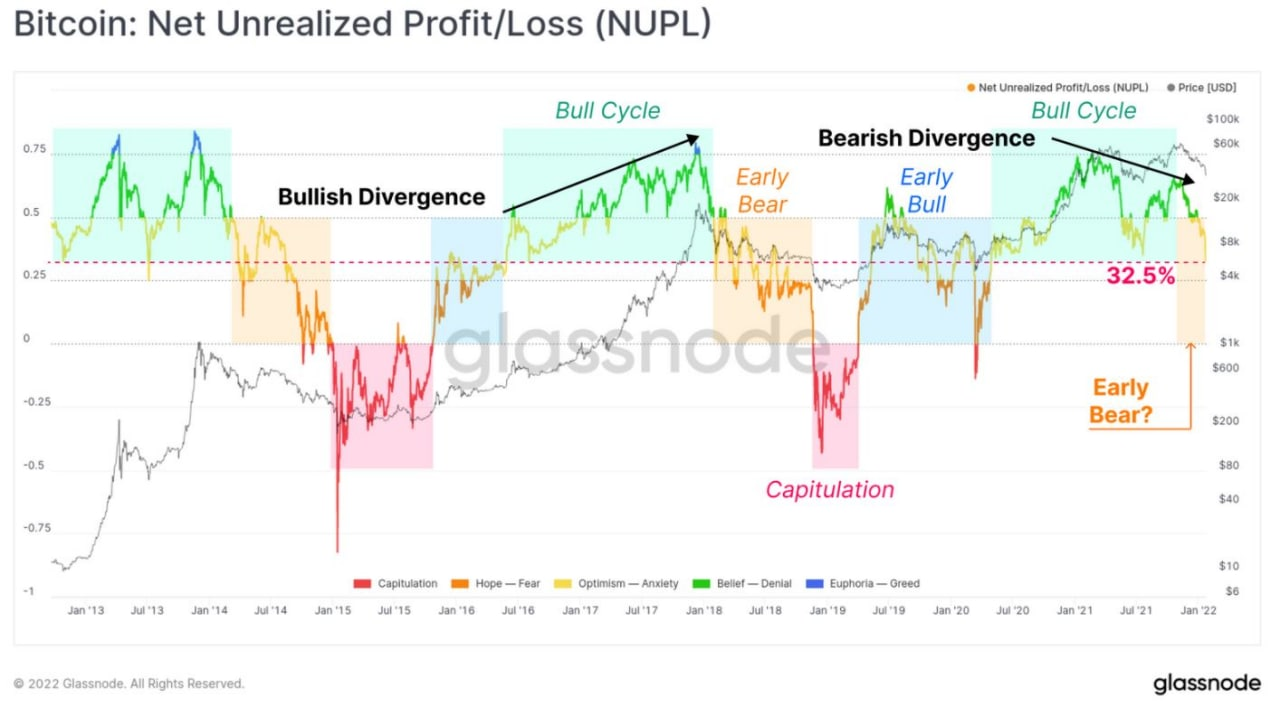
The NUPL is a metric similar to others already posted last week and represents the portion of the total coins in the market that is still in profit.
The black arrow on the right indicates that a bearish divergence was created between the two highs of April and November where profitability (green curve) fell between the two highs, thus contradicting the bullish price trend.
Compare this to the bullish divergence (black arrow in the middle) in 2016, in which the green profitability curve rose faster than the rise in prices.
The current bearish divergence, therefore, suggests that the bear market had already started quietly since May and that we are therefore in a middle phase of it.
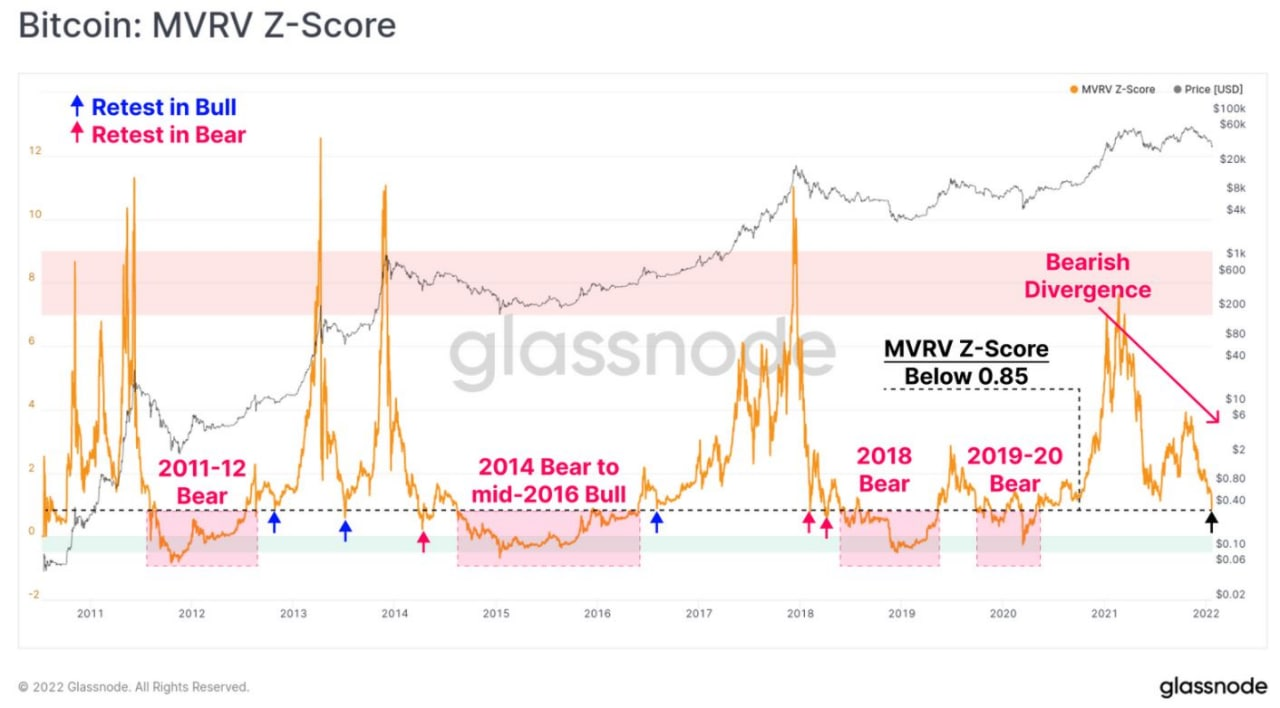
This other metric, instead, that measures the difference between total sales and total losses of all coins on the market compared to an average represented by the continuous dashed line, tells us that it is not yet possible to understand if we are in a bear market or in a simple correction (in the chart, the points of beginning of a bear market are the small pink arrows, while the corrections of a bull market are the blue ones).
Based on this data, therefore, there could still be medium-term rises (to be exploited, if someone still needs to liquidate positions).
Glassnode however posts other indicators, that for brevity I omit, according to which we are at the beginning or the center of a bear market. So the data that support this hypothesis are numerically greater.
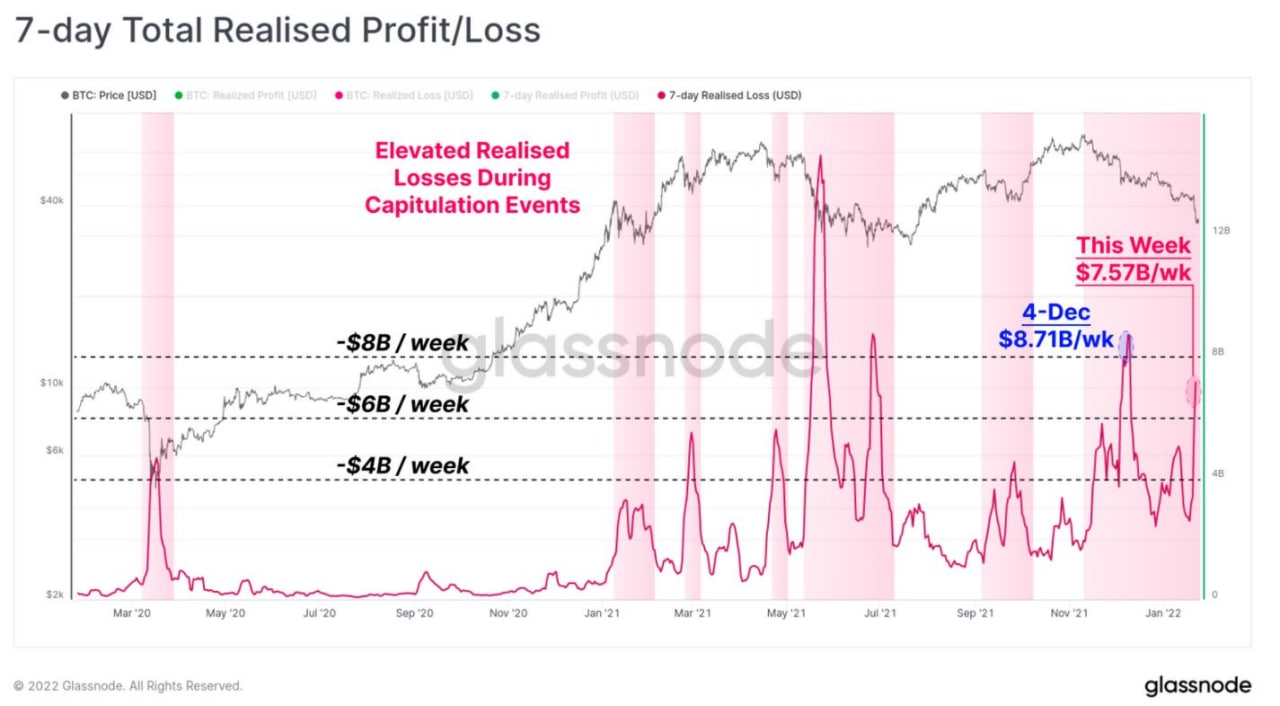
The measure of weekly losses tells us that already since December (so already after the last high touched by the 2021 bull market), the extent of weekly losses (the peaks of the red curve on the right) have been considerable (including the last current peak), compared to the levels of previous bull or bear markets.
We are therefore going through one of the strongest declines ever (let's remember that when it's time to start the season of new purchases at the lows)...
Two other charts, which for brevity I will omit, show that practically all the current losses are of traders who had bought coins in 2021.
In essence, of the coins moved in the 2021 bull market, only about 18% remain unsold by these traders.
So, all the bull market of 2021 can be said to be officially liquidated, or almost, while the seniority of the total coins increases vertically (I omit the chart), showing that long-term holders accumulate more and more.
At the moment, therefore, there is only room for short-term trades, taking advantage of a possible short squeeze in derivatives, while we continue to monitor the data waiting for the first signs of exhaustion of this bear market.
last notes
Last Friday, in the middle of a stock market correction, the SPDR Gold Etf, the largest Etf linked to the price of physical gold, saw the largest flow of new capital inflows ever since 2005, i.e. since this Etf has existed (green area on the right of the chart).
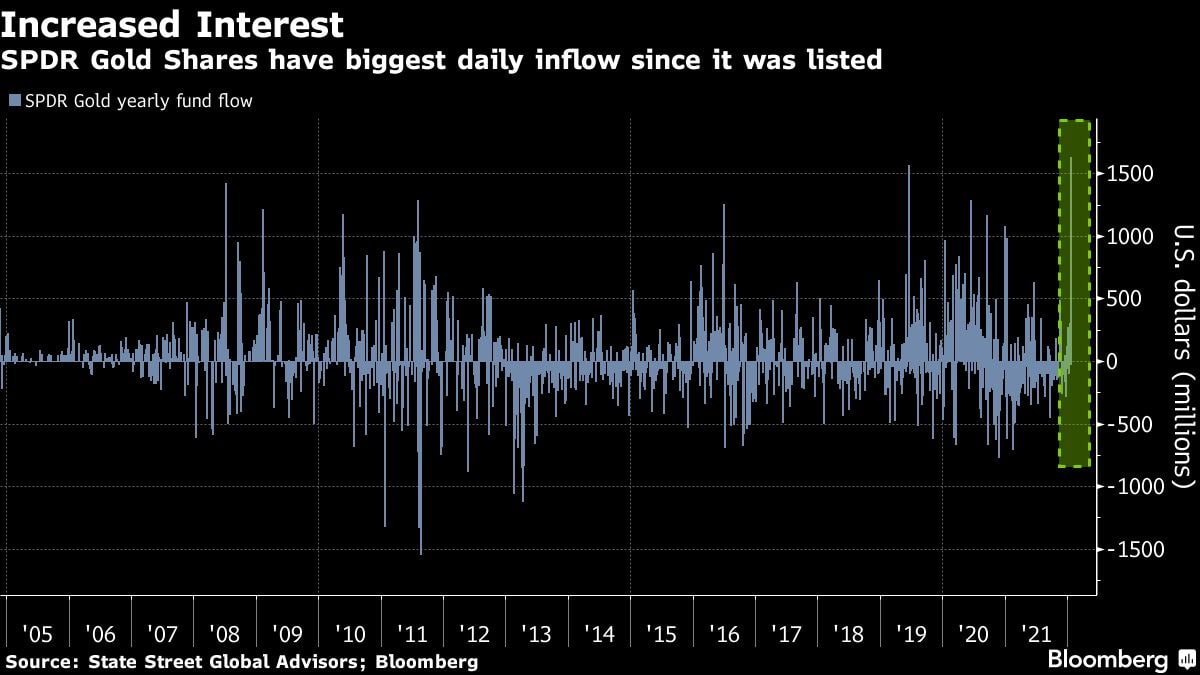
Such a volume of capital buying new shares of the fund in such a short time (and doing the same in other gold-linked ETFs, according to Bloomberg) can only come from institutional investors: banks, mutual funds and insurance companies...
This signal MUST have a specific meaning, as hard as it is to figure out.
Among the few analysts who have caught wind of the news, there are two hypotheses circulating:
the institutionalists already know that the Fed on Wednesday will forego liquidity reductions, or will make an announcement that suggests this, or...
the institutions, by causing the market crash and increasing their positions in precious metals, want to send a message to the Fed, leading it to scale back its plans to reduce liquidity.
At this point I'm really curious to know on Wednesday what the Fed will say...
Thanks for reading.
Posted Using LeoFinance Beta
Congratulations @cryptomaster5! You have completed the following achievement on the Hive blockchain and have been rewarded with new badge(s):
Your next target is to reach 4250 upvotes.
You can view your badges on your board and compare yourself to others in the Ranking
If you no longer want to receive notifications, reply to this comment with the word
STOPCheck out the last post from @hivebuzz:
Support the HiveBuzz project. Vote for our proposal!
Yay! 🤗
Your content has been boosted with Ecency Points, by @cryptomaster5.
Use Ecency daily to boost your growth on platform!
Support Ecency
Vote for new Proposal
Delegate HP and earn more