A Look At The Stablecoin DEX Curve! Data On TVL, Trading Volume, Users | Feb 2023
Over the years Curve has become the number one DEX for stablecoins. Curve provides the lowest slippage and fees for large swaps.
It has become the number one liquidity provider for the industry and in many cases, the other protocols and CEXs are using its pools for their services. There is even a secondary solution build on top of it, Convex that offers boosted yield for exchange of CRV and LP tokens.
Having in mind the growth of the stablecoins and their essential role in the ecosystem, the DEX has positioned itself at a very important role in the industry.
Uniswap has taken a step in the stablecoins direction with its concentrated liquidity pools. Let’s take a look how is the Curve protocol doing under the current market conditions.
At one point Curve had the largest TVL from all the defi apps. The now fallen UST project had its biggest liquidity pool on Curve. Some speculate that this was where the initial attack on UST happen that lead to its collapse.
Here we will be looking at:
- Total value locked
- Trading Volume
- Uniswap V2 VS V3 in trading volume
- Number of users DAUs MAUs
- Top Pairs
- Price
The period that we will be looking at is 2022 - 2023.
The data here is compiled from different sources like DefiLama and Dune Analytics.
Total Value Locked
Here is the chart for the TVL on Curve in 2022.
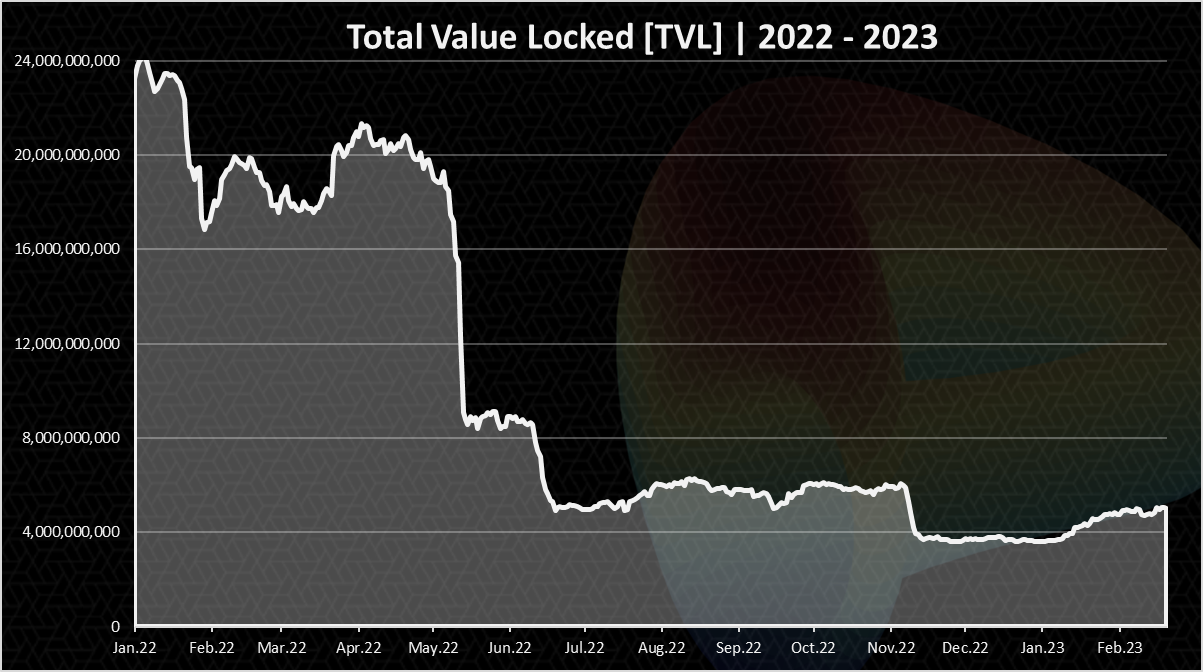
A significant drop in the TVL on Curve in the past year, from 24B to 4B.
The biggest drop that has happened on Curve is back in May when UST collapsed. This has left a huge mark on the protocol and the overall stablecoins market cap and industry. In a period of few days Curve lost more than 12B in TVL. From 20B down to 8B.
We can notice a slight recovery in the TVL in the last month
Trading Volume
Trading volume is extremely important. That is where the fees come from and the APR for liquidity providers. No trading volume means no fees and no capital in the protocol.
The chart for the trading volume looks like this.
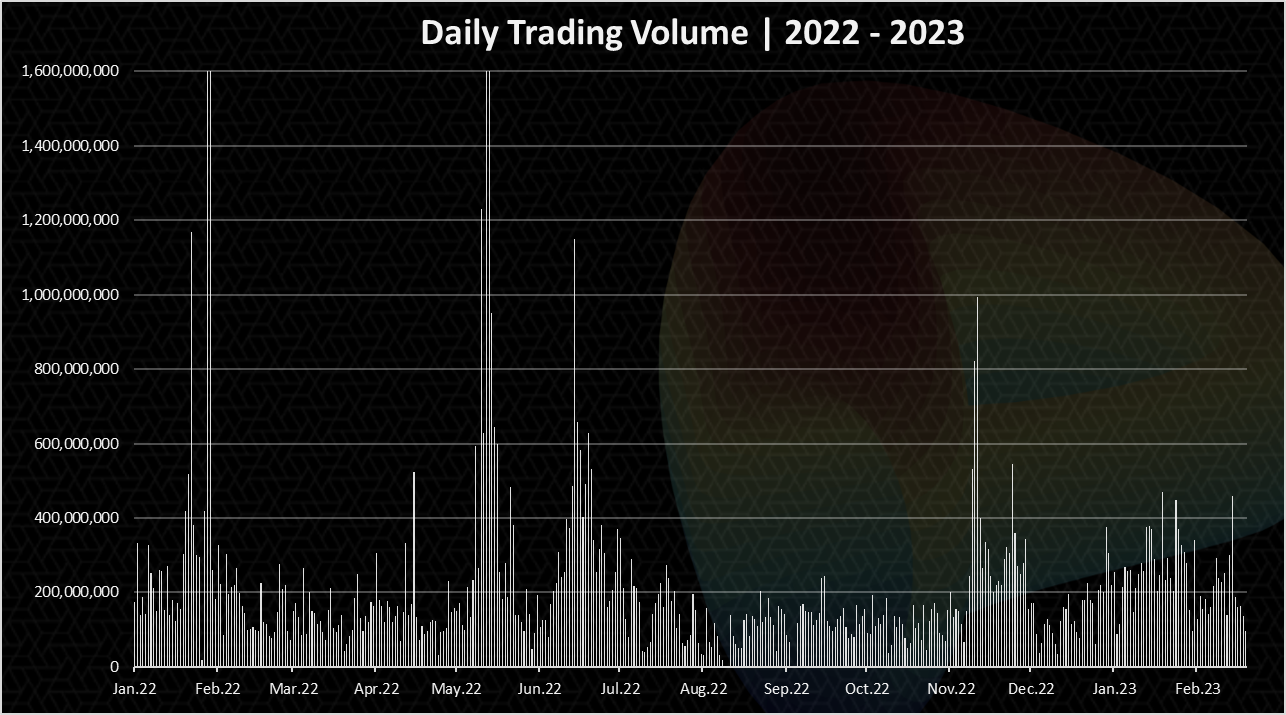
There are a few spikes in the trading volume up to 3B daily on occasions. This usually happens when there are some market volatilities like with FTX and UST.
On regular days the trading volume in 2022-2023 has been quite constant in the range of 100M to 200M per day.
Some uptrend is noticeable here as well int the last days with the daily trading volume in the range of 200M to 400M.
The chart for the monthly trading volume looks like this:
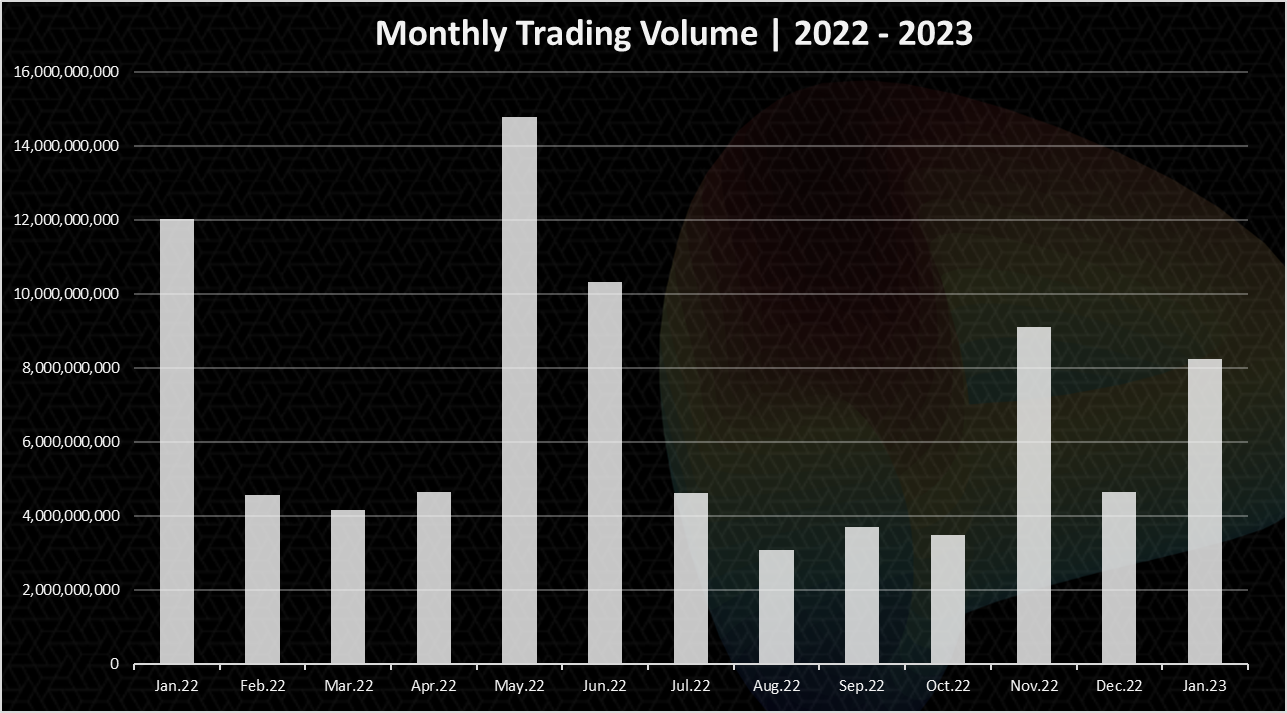
We can notice the high trading volume in May 2022, when UST happened. Then again in November 2022 and now in January 2023 with 8B in monthly trading volume.
DEX VS CEX Volume
If we take a look at the data for the trading volume on the other exchanges provided by some of the aggregators like coingecko the numbers looks like this.
An example for February 16, 2023:
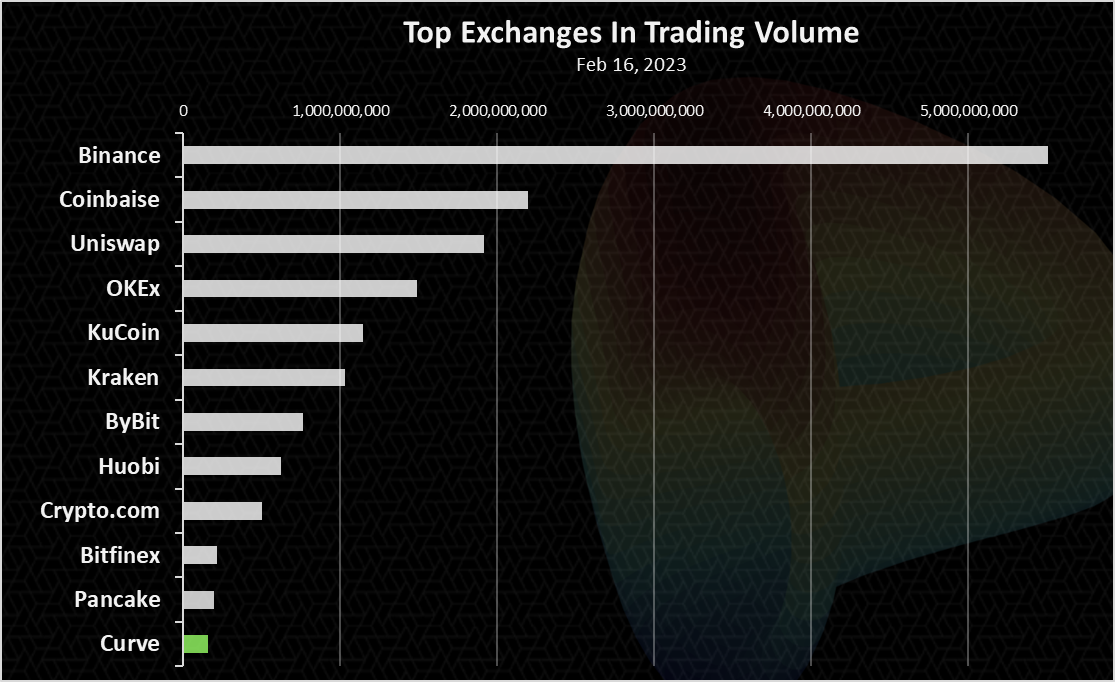
We can notice Curve just made it in the top exchanges in all the categories with 200M per day.
Binance is still dominant with more than 10B, followed by Coinbase with 2B. Uniswap is now no.3 exchange in the world, and it is a DEX. It has almost 2B daily volume these days.
Active Users
How many users Curve has? Here is the chart.
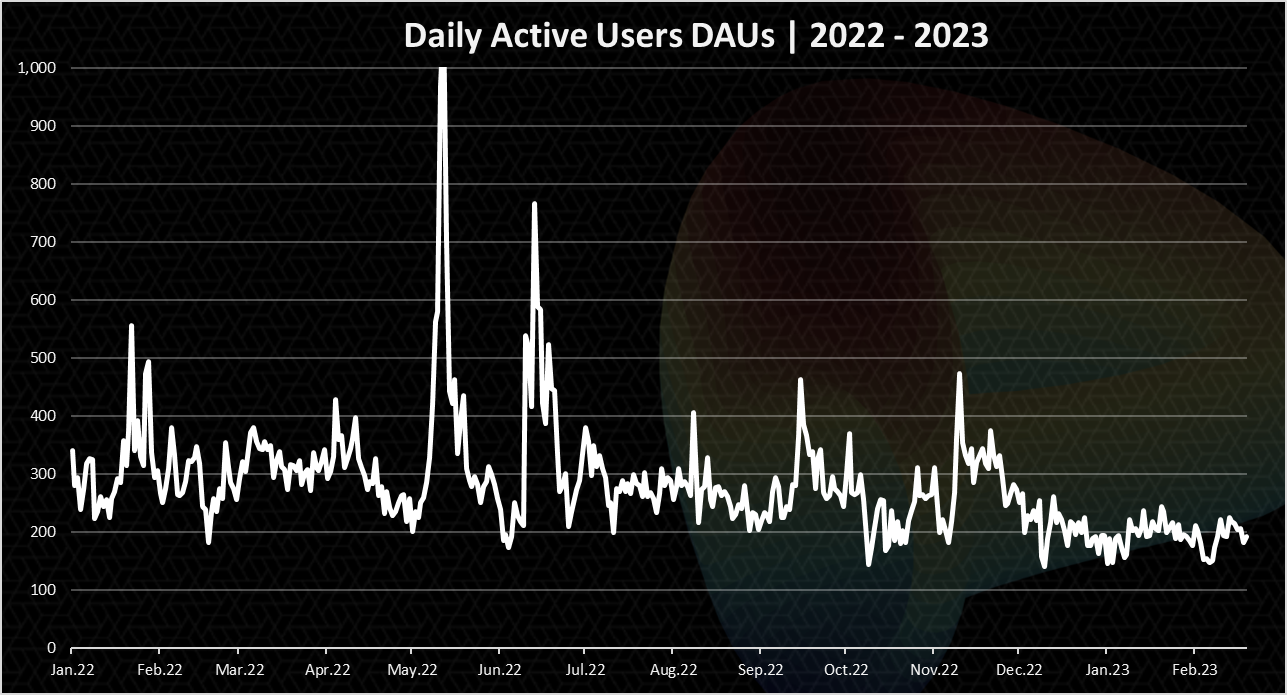
Curve has not that many users, but the numbers seem quite constant. Throughout all the year there has been around 300 DAUs and a slow decrease towards the 200 DAUs. This again shows the protocol is used on an industrial level, from other apps and not by individual users. It makes sense since its primary use is for large stablecoins swaps. Not a lot of users have a large amounts stablecoins to swap around.
On a monthly basis the chart looks like this:
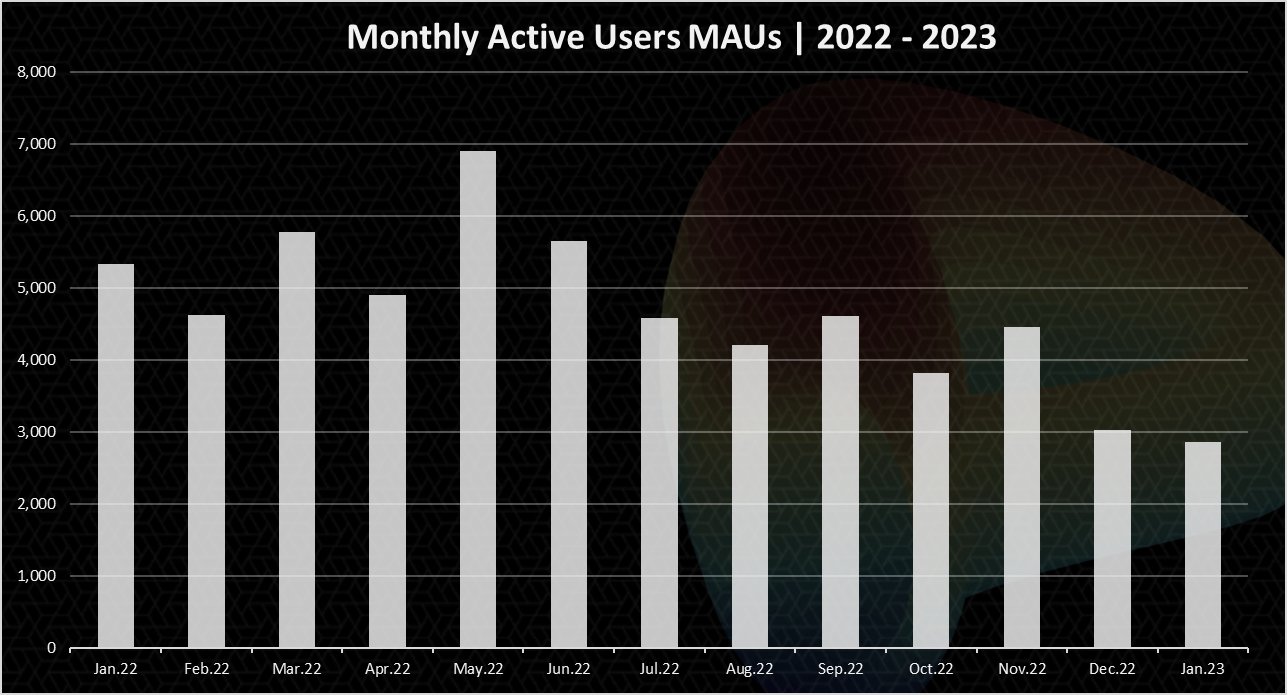
The number of monthly users is a bit higher than the daily ones and it is around 3k. There has been an increase in May 2022 to 7k monthly users and a drop afterwards.
Top Liquidity Pools on Curve
Here is the chart for the top pools ranked by liquidity.
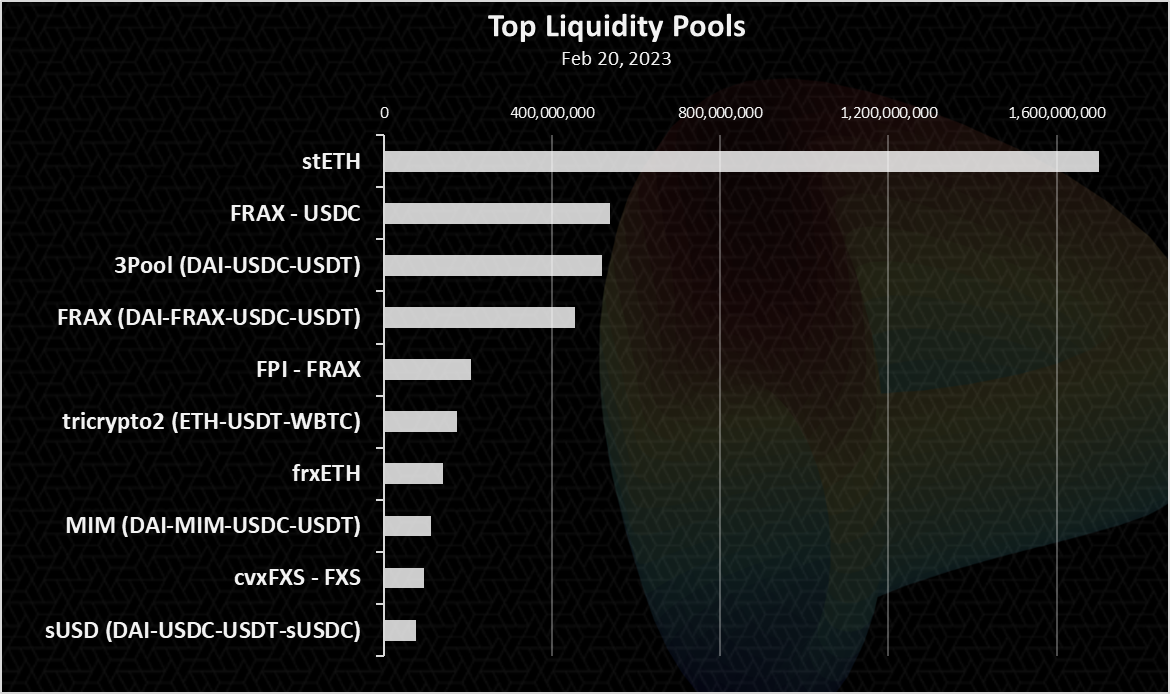
The staked ETH is on the top here with a value of 1.7B at the moment.
The other pools are predominantly stablecoins. The 3Pool (DAI-USDC-USDT) has been one of the major ones traditionally with a 520M at the moment. Then the FRAX pool, for the FRAX stablecoin and the other three stablecoins with around 500M.
The tricrypto2 (ETH-USDT-WBTC) is in the top as well with almost 200M.
Price
The all-time chart for the CRV price looks like this.
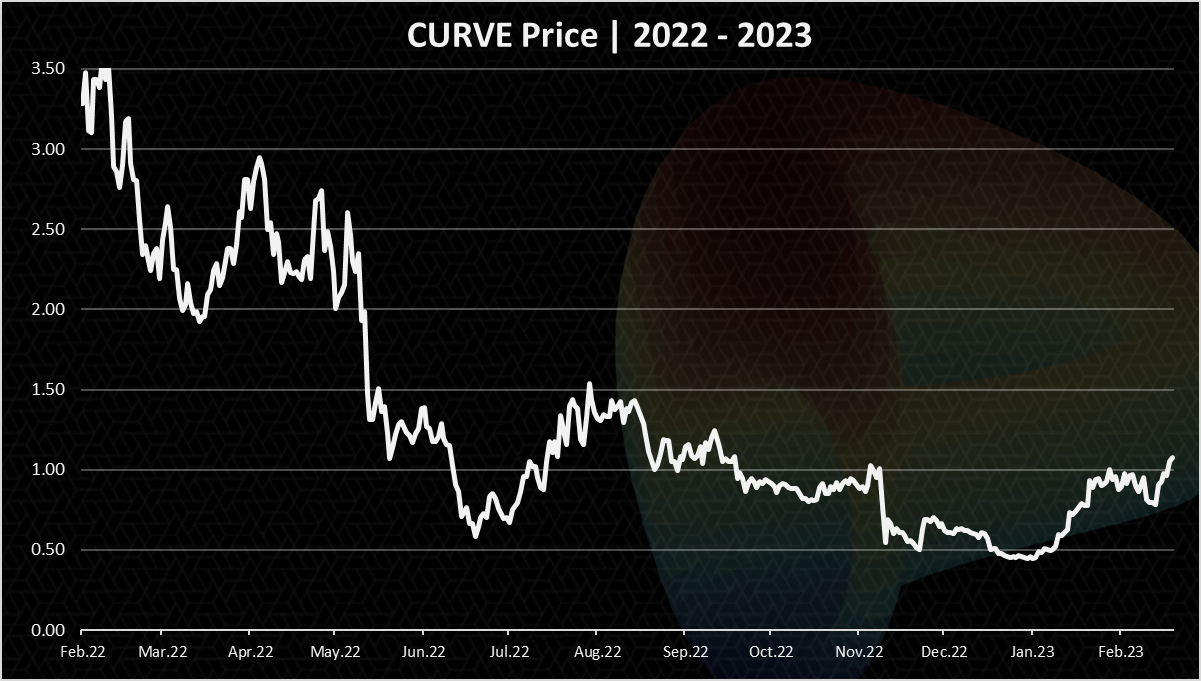
Quite the downtrend for the token. The bear market has been especially rough for defi coins and CRV is not an exception. The last year started with a token price of 6$. Then a sharp drop all the way to 3$ and it stayed in the range of 2$ to 3$. After May it dropped under 1$. In November 2022 after the FTX collapse CRV dropped even further to 50 cents.
In the last month, there has been a recovery and CRV is back to $1 again.
Summary
A massive drop in the Curve TVL in the last year, with a small sign of recovery in the last month. The number for trading volume and users are quite stable in the period with occasional spikes. The staked ETH pool keeps growing and now is at 1.7B. The other top pools are stablecoins. The price has seen a slight recovery from 50 cents to a dollar, after the massive drop in 2022.
All the best
@dalz
Posted Using LeoFinance Beta
https://twitter.com/1012995341468295168/status/1627646085760950272
The rewards earned on this comment will go directly to the people( @dalz ) sharing the post on Twitter as long as they are registered with @poshtoken. Sign up at https://hiveposh.com.
interesting figures
Thanks for this amazing data , the information is very useful..
Your way of explaining is very incredible, You have explained all these things in such a sweet way and you must have put a lot of effort or knowledge to make this post, I really like it.
Curve is a good token. Its now $1.23 perhaps a good time to accumulate more tokens !
Its not about timing the market, but time in the market :)
DCA FTW!
@dalz Indeed interesting and detailed figures elaborating the required info. You really explain pretty well Dalz !!! It shows a lot of sincere effort put in preparing these stats and sharing them.
Stay connected !
Regards,
Amit
Thanks!
It definitely had a huge drop in locked coins... A HUGE one!
But with that said the daily trading volume and average daily users remained the same... Why would that be?
The biggest cost is controlling the supply and demand of stablecoins, as we've seen when the Luna team couldn't control it, both of their coins came down pretty badly. Every time a scene like this happens in the market, every coin goes down the way it came but in the last month it has stabilized again at one dollar. Curve is a very good token. The team behind it is also very hardworking, we will see in the coming bull market it will go up a lot and give good profit to its users.
24B to 4B was one of the biggest Drop, You are right, trust is the biggest factor when it comes to investing in crypto Currencies, Due to UST , Investors Trust on the Curve Got drop massively, Hopefully they will get the trust back, but it is very hard.
It does not even have Hive