Ethereum VS Solana | Data On Wallets, Transactions, Fees and Market Cap
Solana has been gaining reputation as one of the major competitors to Ethereum. In the last year it has developed a vibrant ecosystem with a lot of DeFi, NFTs and gaming applications.
Let’s take a look at some data of the two and compare them sided by side.
We will be looking at:
- Total number of wallets
- Active wallets
- Transactions
- Fees
- Market cap
The data presented here from the etherscan charts and some from Dune analytics where I have forked existing queries for Solana and adjusted the time frame.
The period that we will be looking at is from Jan 2020 to July 2022.
Number of Wallets
Here is the chart for the total number of Bitcoin wallets created.
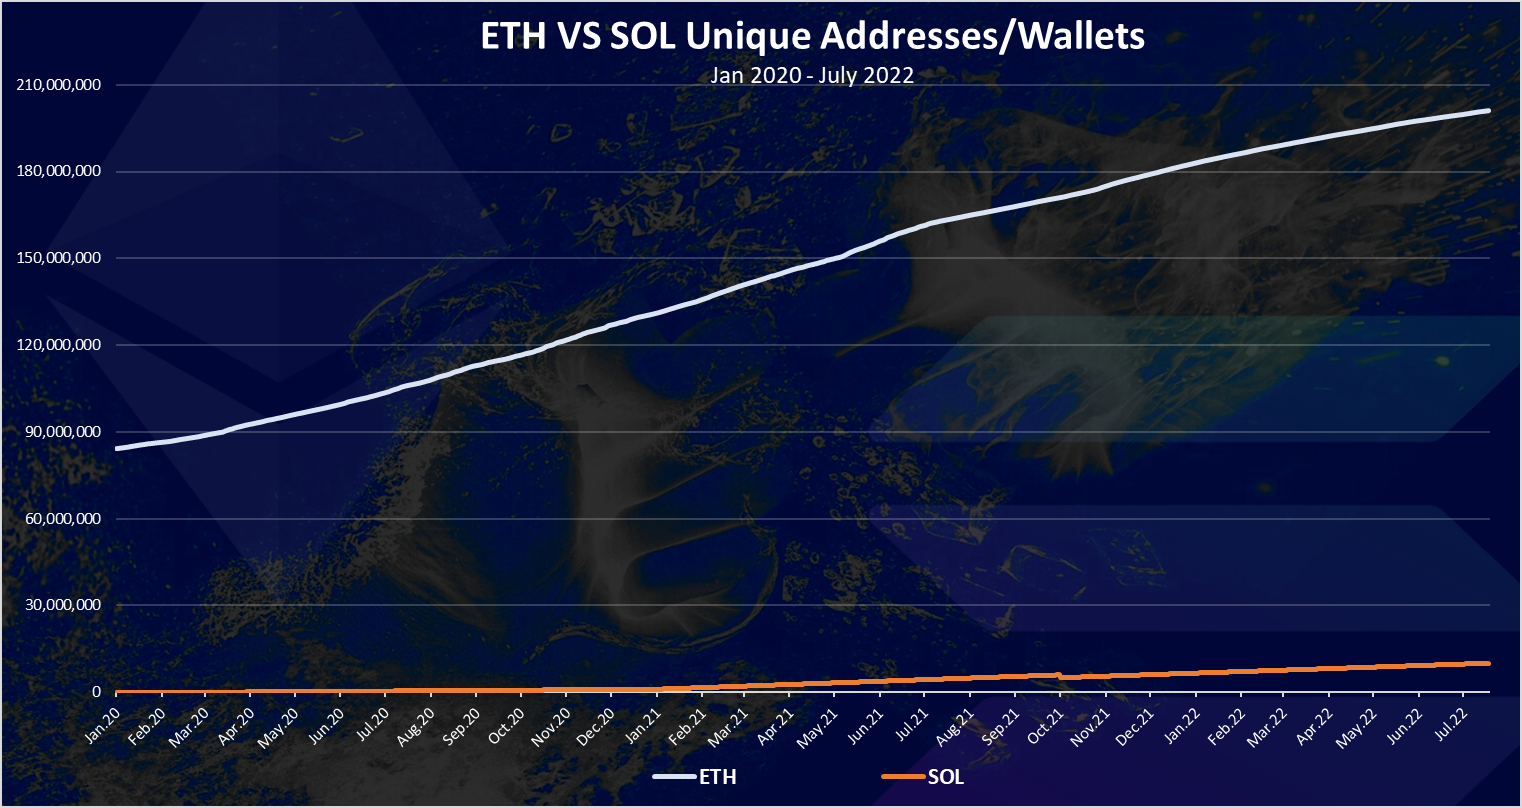
Note the number of Solana wallets is estimated, since there is no data for it. If anyone has some reliable source of data for this please let me know.
Ethereum has been growing constantly in terms of wallets from under 100M in Jan 2020 to more than 200M now.
For Solana, as noted above there is no official data for the numbers of wallets and there is just some scattered information on the web. In the chart above the wallets are projected to 5M in 2021, and 10M in 2022.
As we can see the difference here is huge in favor for Ethereum.
Active wallets
What about the number of active wallets? How many of the existing ones are active?
Here is the chart.
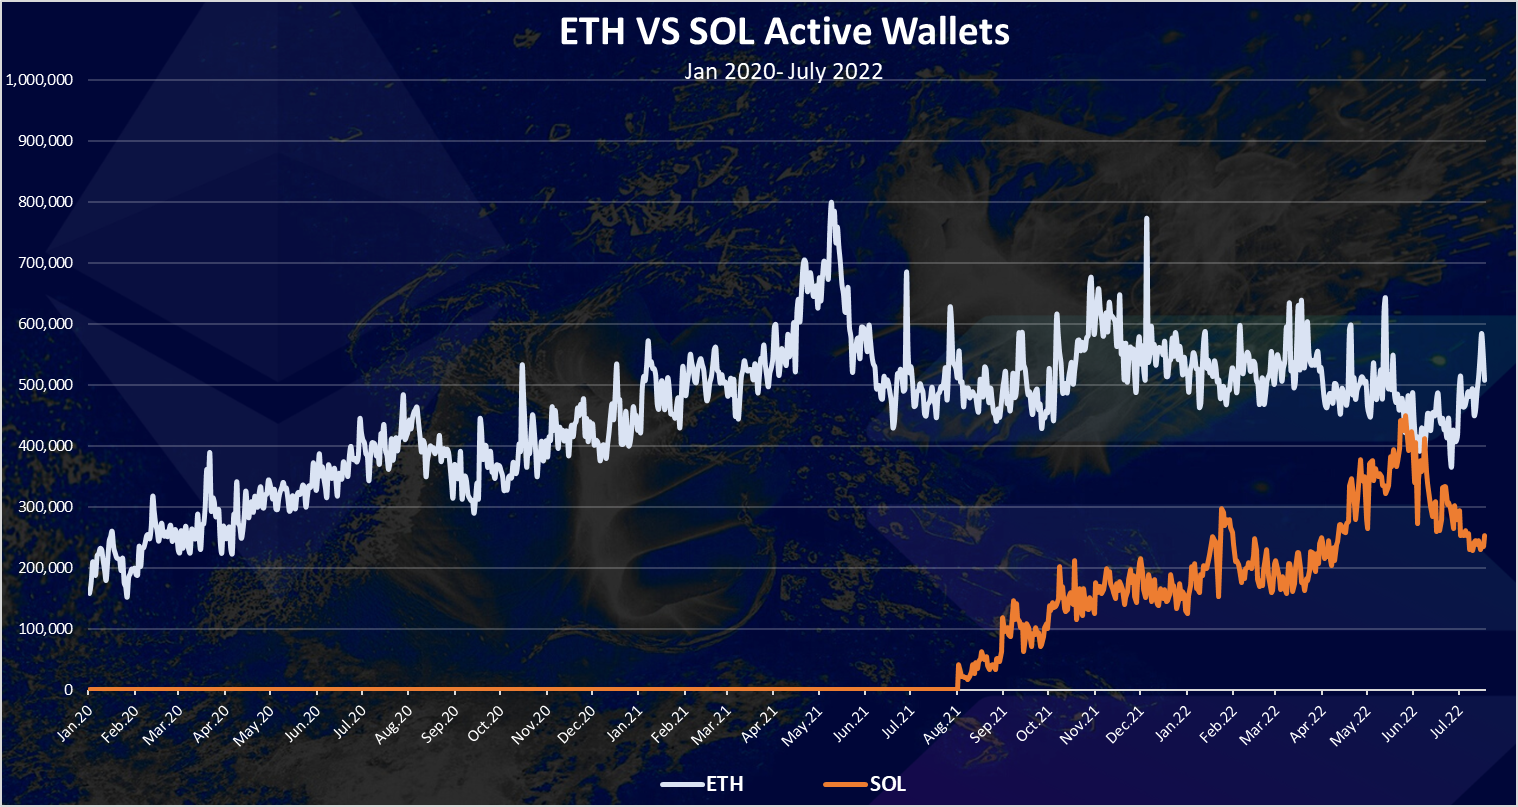
Ethereum is leading here as well but not by that much. Solana got very close to ETH and even had a bit more active wallet on the begging of June 2022. Now ETH is in the lead again.
In the last two years the number of daily active wallets for Ethereum has went from 200k to an ATH of 800k active wallets per day. In the recent period the number of active wallets on ETH are between 500k to 600k.
On Solana the ATH for active wallets has been around 440k per day. In the recent period the number of active wallets is around 250k daily.
Transactions
The activity on the network is mostly represented by the number of daily transactions.
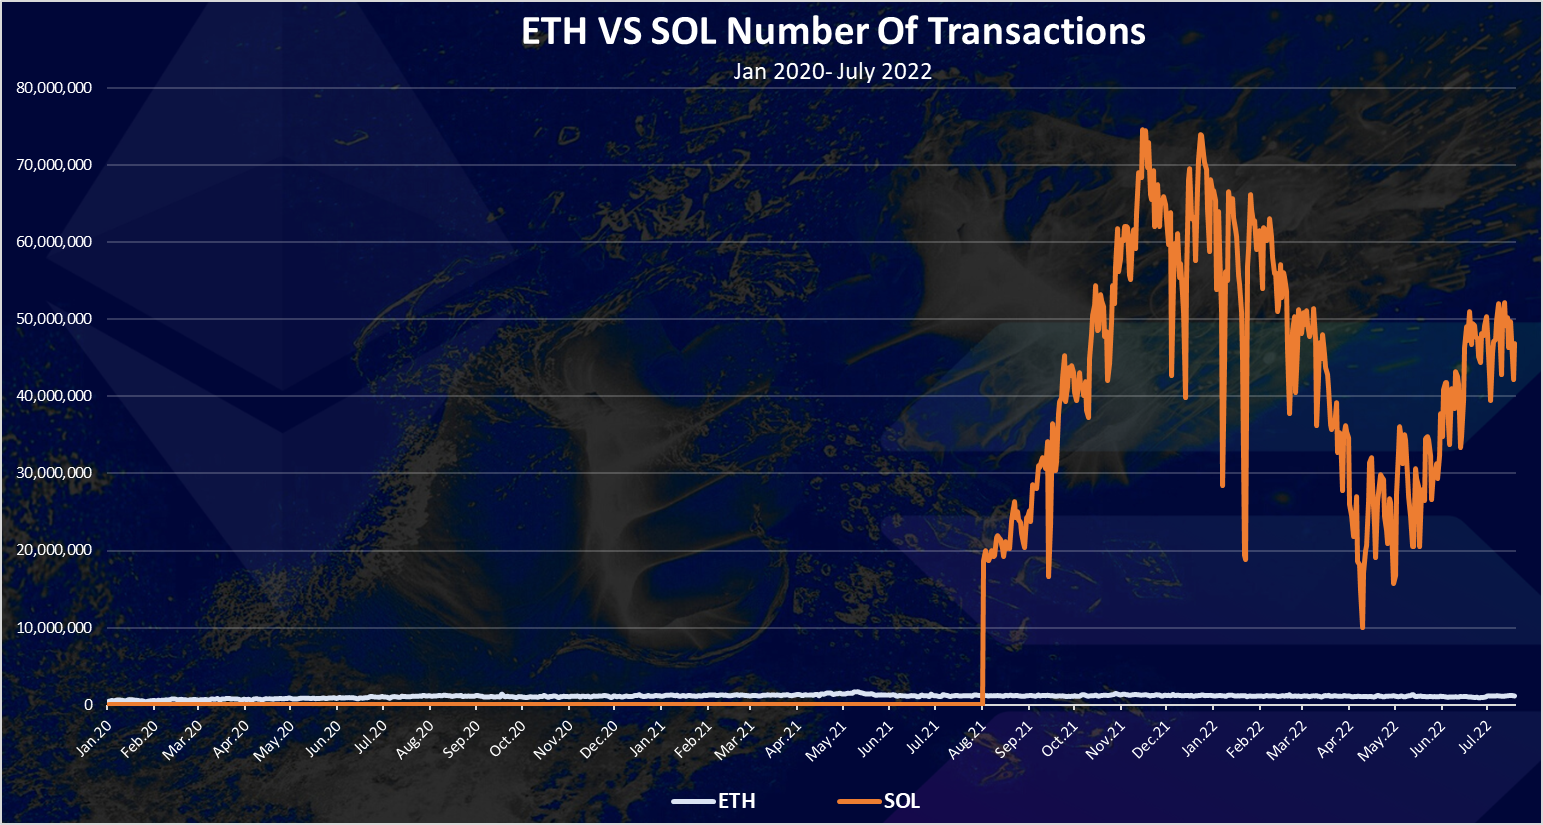
In terms of transactions, speed and fees this two blockchains are quite the opposite.
Solana has made a reputation for its speed and low fees. It is the fastest blockchain in the industry atm. We can see this from the chart above as well.
Solana has a record high of 70M transactions per day, while the Ethereum ATH is around 1.8M. The Ethereum number for transactions is barely visible on the bottom of the chart because the high numbers on Solana.
In the last period ETH has 1.2M transactions, while Solana is between 40M to 50M.
But even with this huge number of transactions, the active wallets on Solana are less then Ethereum. This means that fewer wallets are making a lot more transactions on Solana.
Fees
We have seen the number of wallets and transactions. What about the fees. Here is the chart.

In terms of fees, we can only see the line for ETH on the chart above 😊.
The fees for Solana are almost stuck to the axis.
The fees on Ethereum have went up as high as 70$ per transactions, while in the recent times they are much lower, somewhere around $5 or less, depending on the type of the transaction. On Solana the fees are in the third decimal, somewhere around 0.001. The low fees are also one of the reasons for the high number of transactions.
Market cap
At the end a look at the market cap.
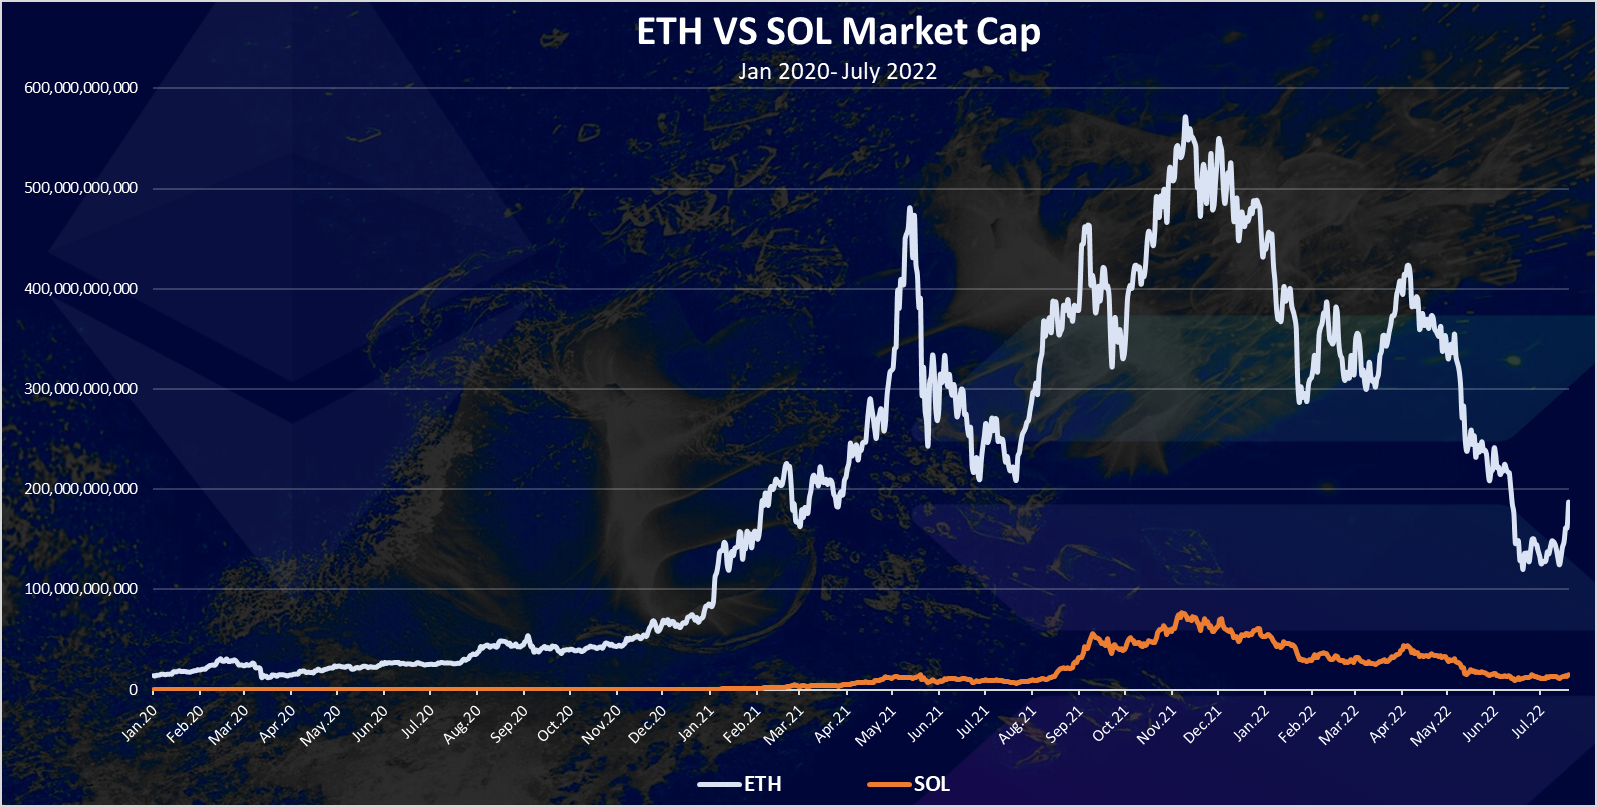
At the beginning of 2021 the Ethereum market cap reached 100B and continue to grow to more than 500B in November 2021. Since then, we have a drop in the market cap and a slight growth in the last days to 185B.
Solana has increased its market cap a lot as well, but it is much lower compared to Ethereum. The ATH for Solana market cap was around 80B in November 2021, while now it stands to 14B.
A 187B for ETH and 15B for SOL in the last days.
Recap
| ETH | SOL | |
|---|---|---|
| Wallets | 201,152,905 | 10,000,000 |
| Active Wallets | 507,492 | 240,000 |
| Daily Transactions | 1,213,565 | 45,000,000 |
| Fees | 5 | 0.001 |
| Market Cap | 187B | 15B |
Overall, we can see that Ethereum is still leading by a lot in terms of total number of wallets and active wallets. Solana is dominant on the number of transactions and the very low fees. In terms of market cap, Solana has less then 10% of the Ethereum market cap at the moment.
All the best
@dalz
Posted Using LeoFinance Beta
https://twitter.com/Dalz19631657/status/1549819337762111488
https://twitter.com/yerani_ferrer/status/1549827412988465152
The rewards earned on this comment will go directly to the people( @dalz, @lindoro ) sharing the post on Twitter as long as they are registered with @poshtoken. Sign up at https://hiveposh.com.
very interesting comparison, active Solana wallets came quite close to ETH.
Yea, I was surprised by this as well. Quite close. But still becouse of the low fees on Solana, they can be gamed easily and cannot tell how real those accounts are.
true, good point, such data has to be taken with a grain of salt always.
Solana has fast transaction and low fees. It's the fees that I quite like. Now Solana is down a lot from the ATH, might buy some !
Posted using LeoFinance Mobile
Solana is efficient in the NFT space. Magic Eden, the NFT marketplace of Solana, was used by 100k users last week. For context, Opensea was used by 142k users last week. So, Magic Eden is in second place according to Dappradar stats
Posted Using LeoFinance Beta
Yea they seem to be doing good with NFTs
Great Post!
!1UP
Click the banner to join "The Cartel" Discord server to know more!
You have received a 1UP from @luizeba!
@leo-curator, @ctp-curator, @vyb-curator, @pob-curator
And they will bring !PIZZA 🍕.
Learn more about our delegation service to earn daily rewards. Join the Cartel on Discord.