More Than 15M HIVE Powered Up In 2022 | On Track For A Record High Year
The amount of Hive Power keeps growing!
Thing is the overall supply for Hive is increasing as well. So does the liquid Hive in absolute and relative numbers is going up or down?
Let’s take a look at the data.
@thepeakstudio image
We will be looking at:
- Hive Powered Up By Date
- Hive Powered Up By Month
- Hive Power Supply
- Hive Power Share
- Top Accounts That Powered up
- Top Accounts That Powered Down
The period that we will be looking here is from the creation of the old chain 😊, March, 2016, with a closer look to 2022.
Hive Powered Up
Here is the chart for the all-time Hive powered up.
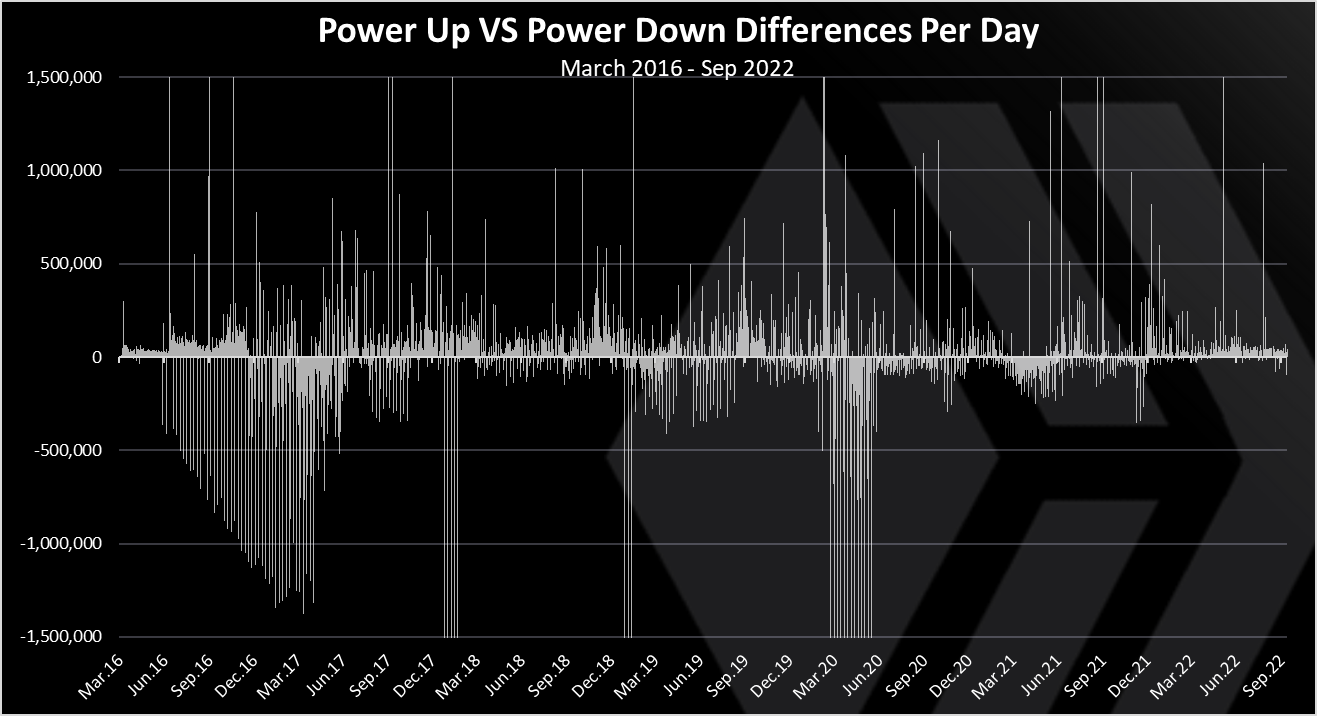
These are daily net columns that sum up the HIVE powered up and down for the day. Positive column means that there is more powering up on that they, and negative more powering down. The HIVE power from rewards/inflation is also included.
We can notice that there are some big power downs in 2016 and 2017, and then again in March 2020, after the hostile takeover. In the recent period we can see that the powering up has been mostly positive.
When we zoom in 2022 we get this:
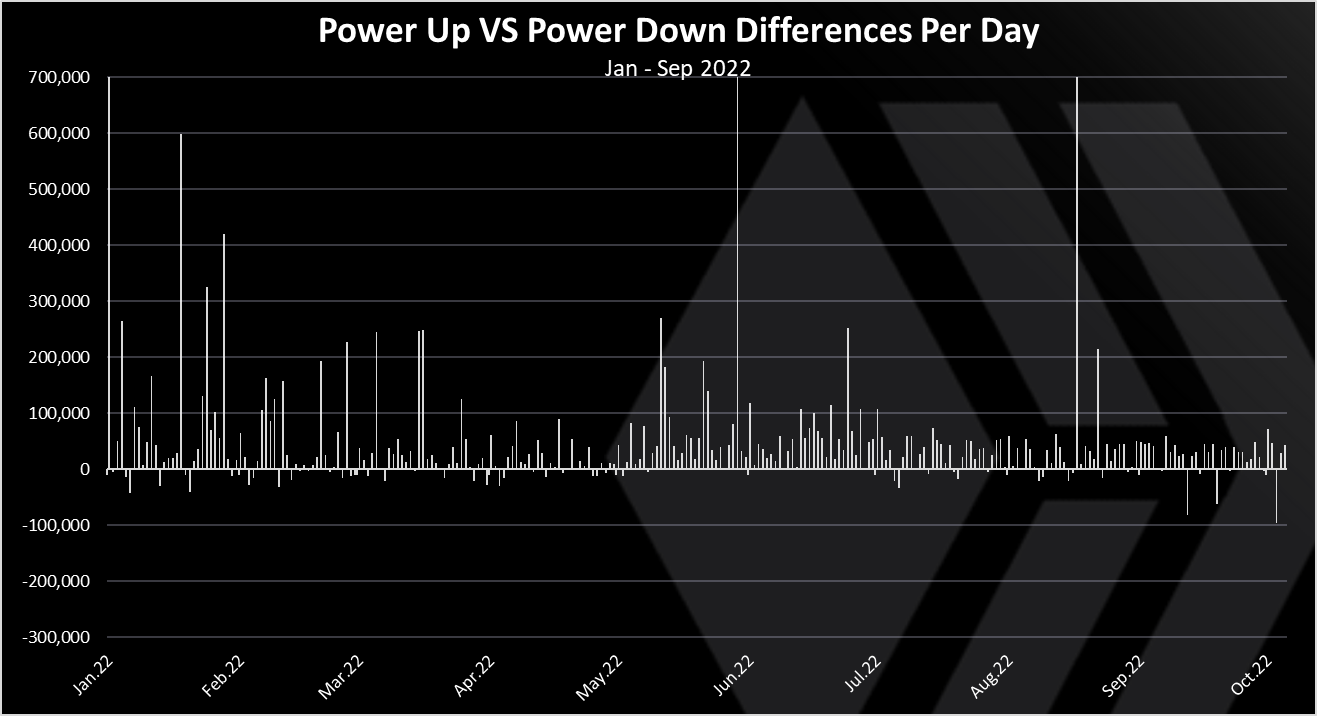
All of 2022 is mostly positive in terms of Hive Power. Note again that the additional Hive Power from rewards (author, curation, witness) is also added in the chart.
On a monthly basis for 2022 we have this:
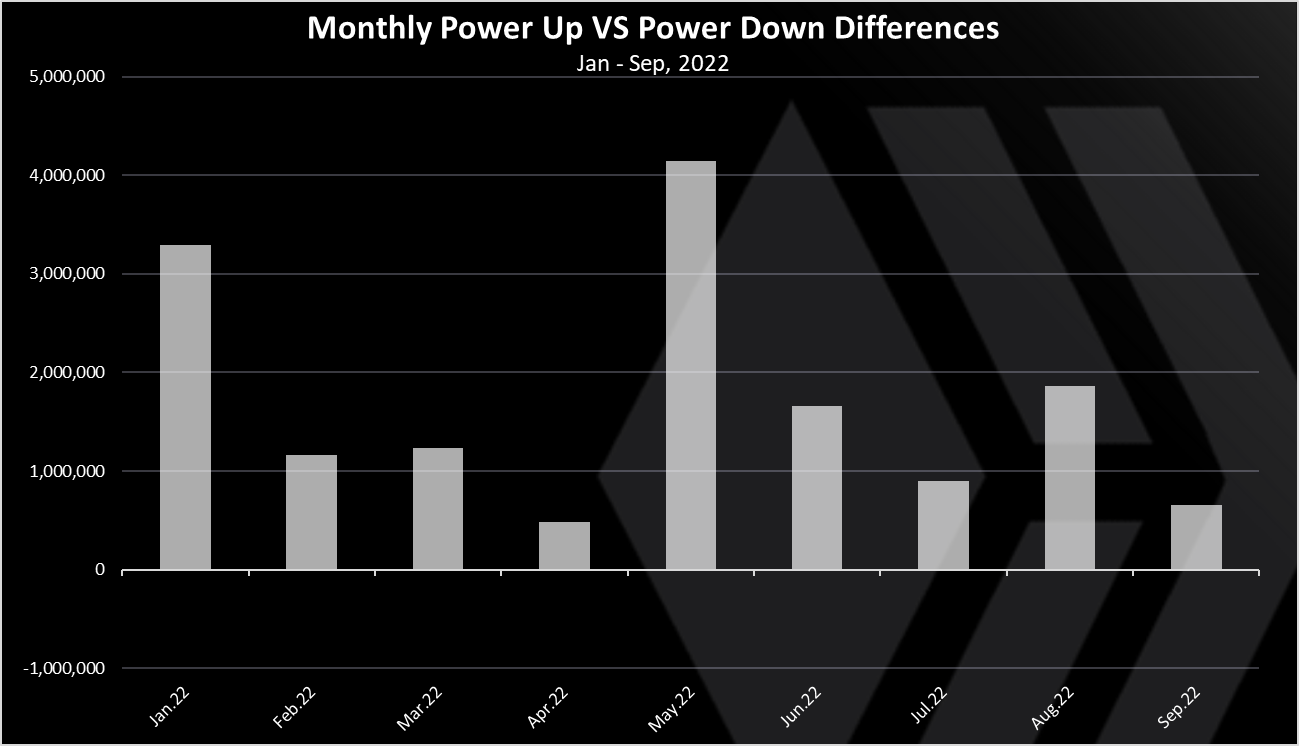
Every month in 2022 is net positive in terms of Hive Power. More Hive Power has been added than removed.
The record high is May with more than 4M, while in the last months this number is between 1M to 2M HIVE powered up.
The yearly chart looks like this.
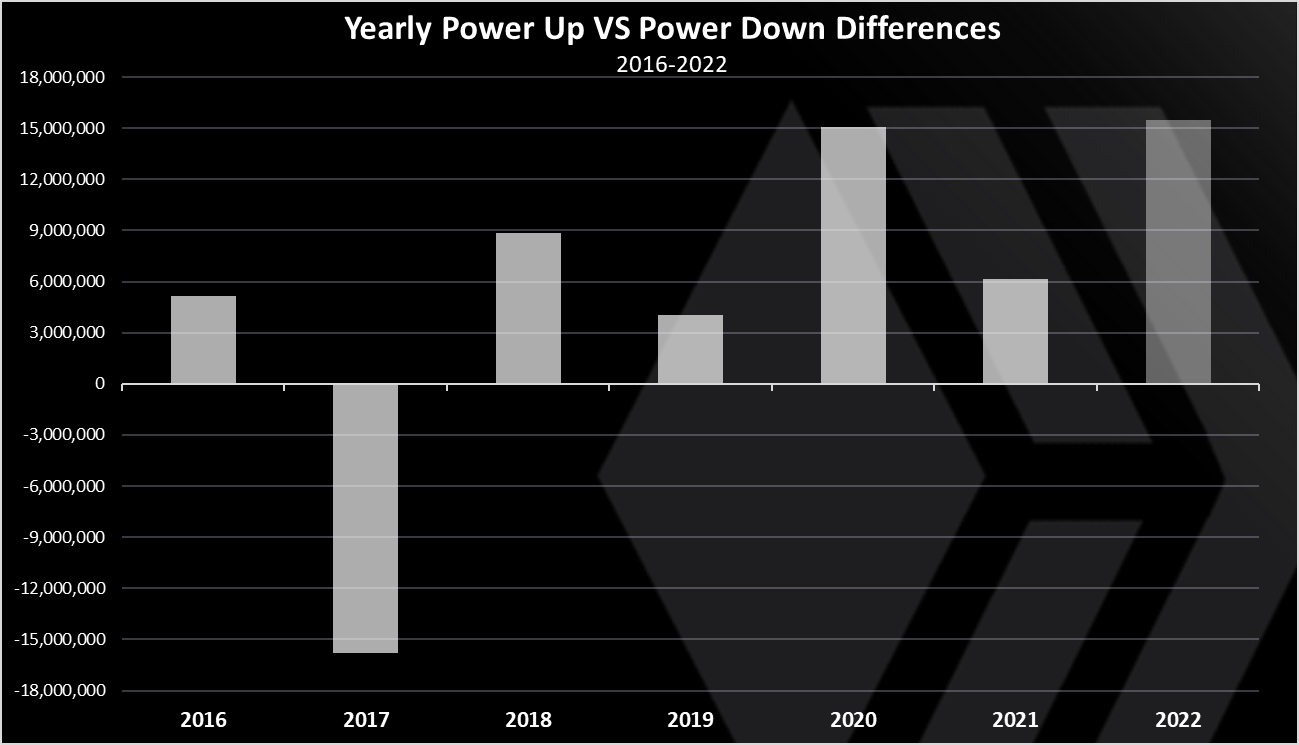
2017 has been the one year with more HIVE powered down. A net 15M HIVE powered down in 2017. This year 2022 is on track for a record high amount of Hive Powered up. It is already clear that it will be a record year since it surpassed 2020, that holds the previous record. The year will probably end somewhere between 18M to 20M HP.
HIVE Power Cumulative Supply
When we plot the cumulative HIVE power in the period, against the total supply we get this.
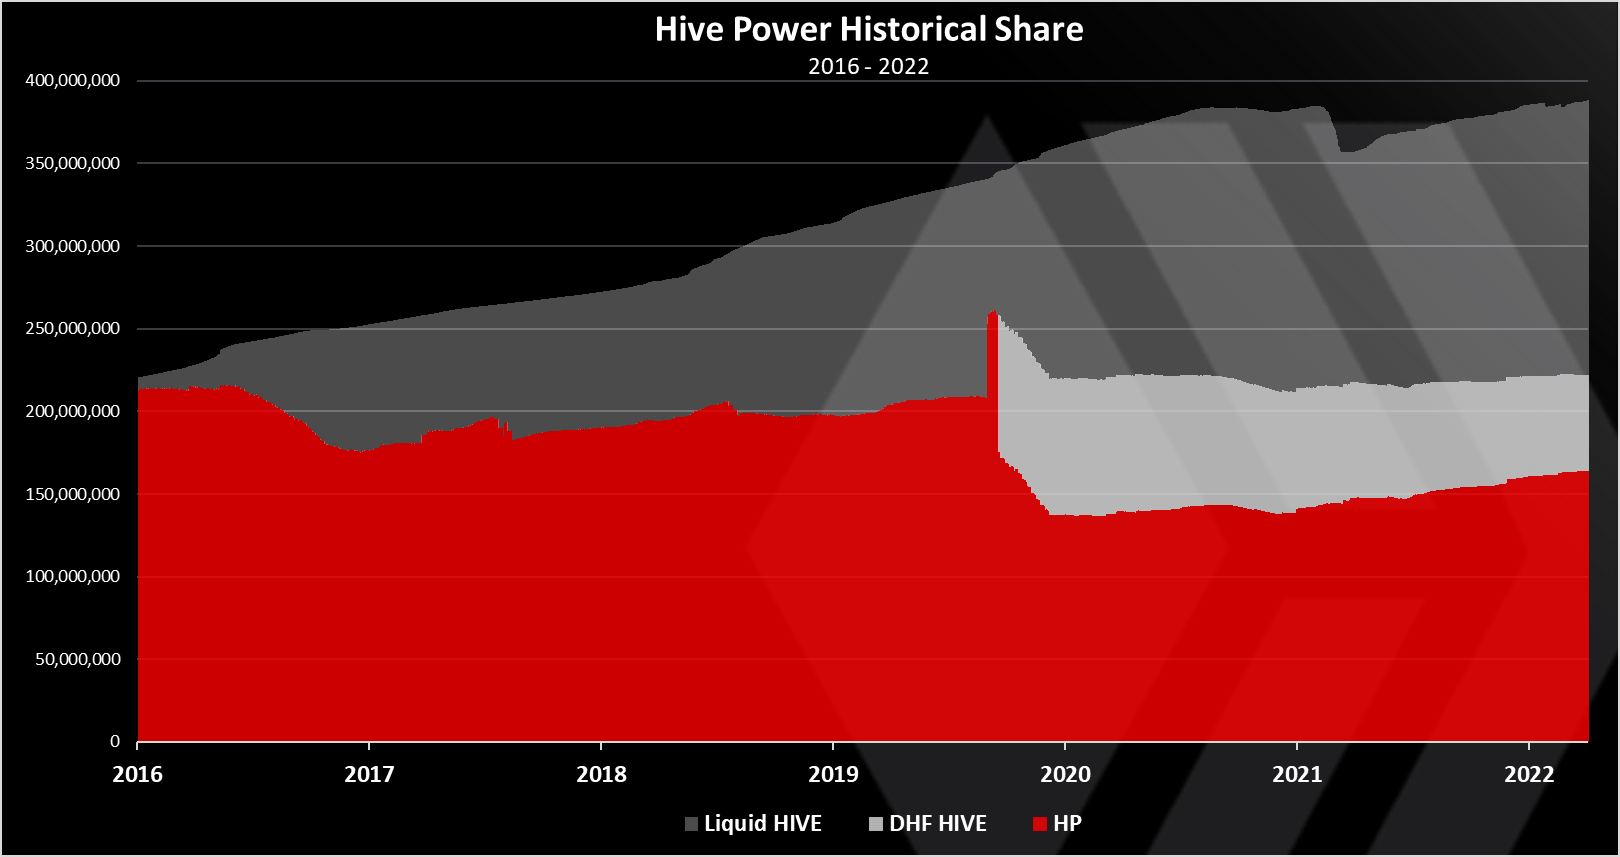
The red is HP, the middle one is HIVE in the DHF. The light is the liquid HIVE.
We can notice that in the last two years there is a significant uptrend in the amount of HIVE powered up.
The HIVE in the DHF was previously powered up, but then it was transferred in the DHF and is now slowly converted to HBD over a period of five years. Two gone, three left to go 😊.
Overall, the HIVE power has been growing slowly in the whole period, but the liquid HIVE has even more aggressive expansion up until 2021.
Hive Power in 2022
When we zoom in on Hive Power only, we get this.
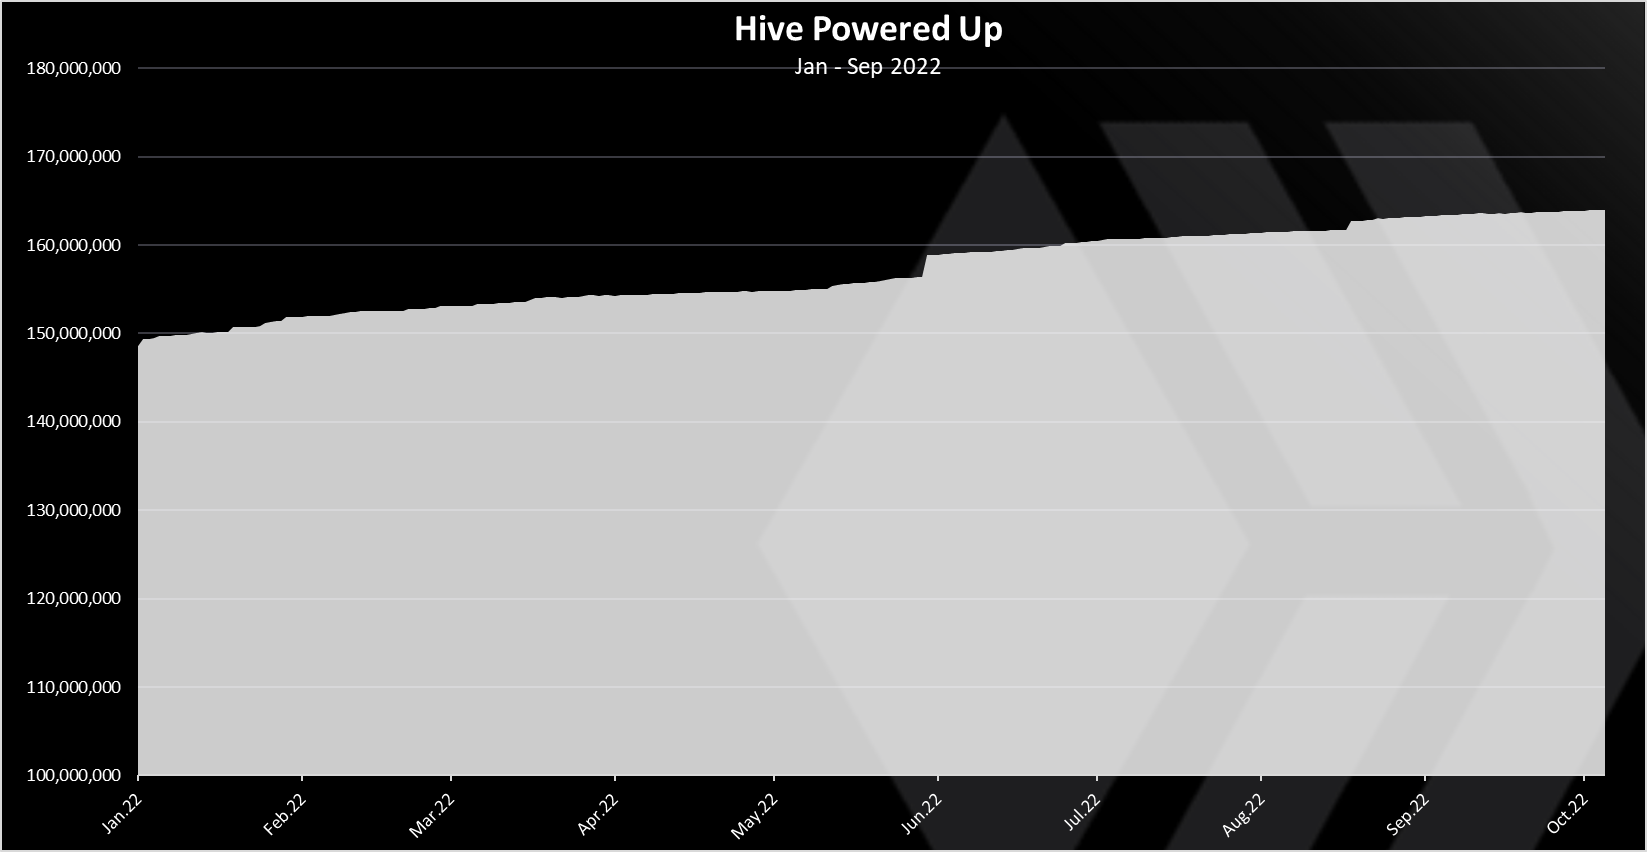
An overall uptrend throughout the year.
The year started with 148M HP and we are now at 163M HP. A few big power ups in the period, in May and again in August.
Liquid HIVE
The share of liquid HIVE in 2022 looks like this.
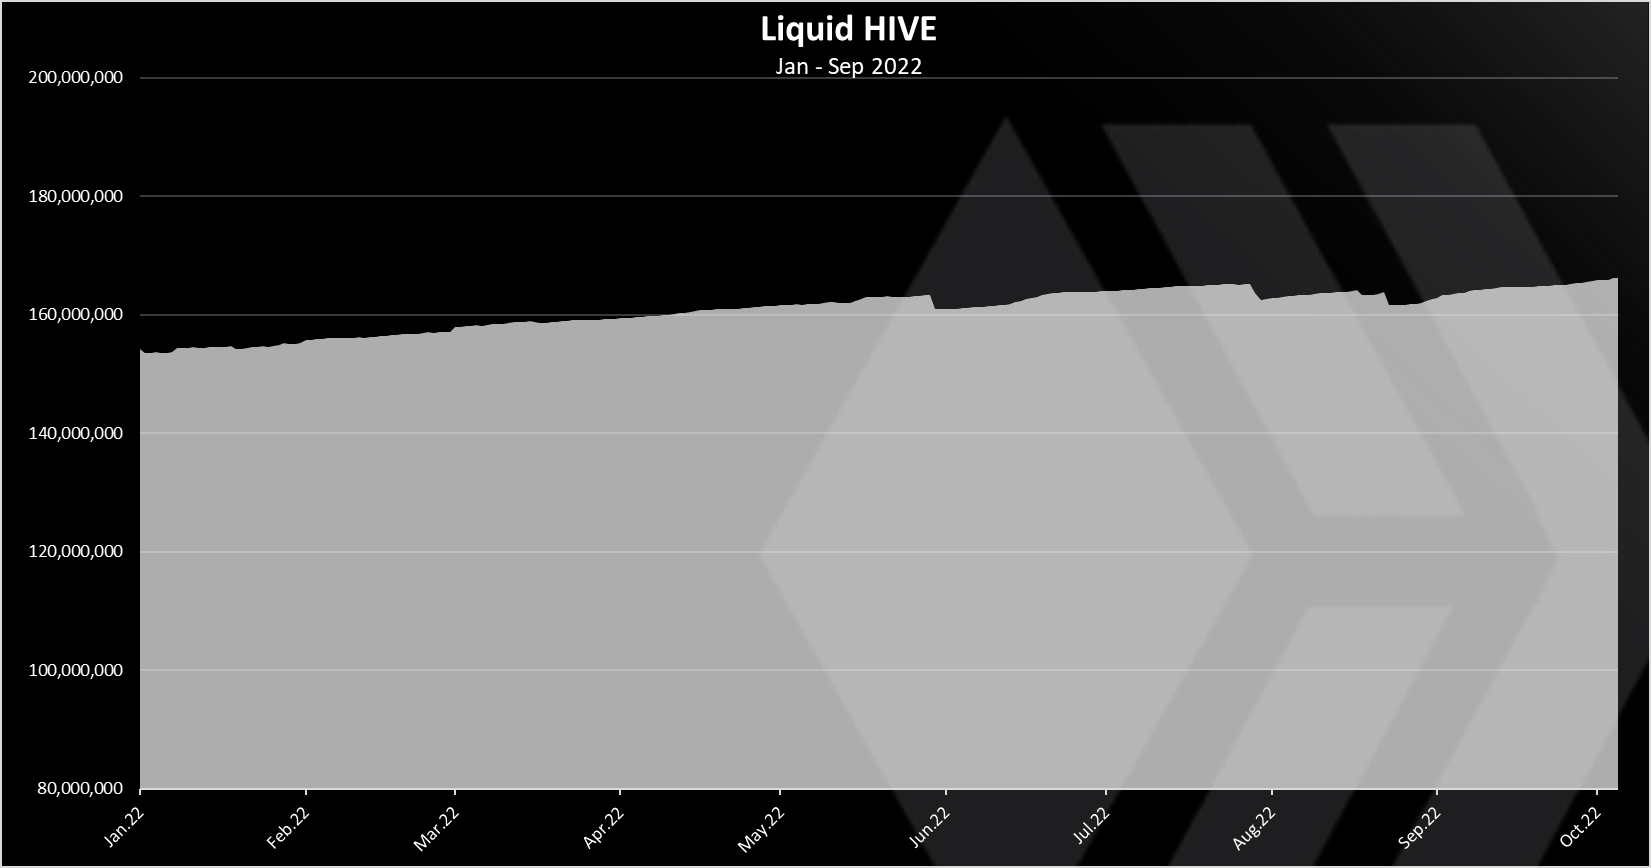
A steady uptrend here as well with some spike on the downside. This happens usually when there are conversions to HBD.
At the beginning of the year there was 154M liquid HIVE and now we are at 166M liquid HIVE. An increase of 12M, but still a bit smaller than the 15M growth for HP.
Liquid VS Locked HIVE In 2022
The term locked HIVE is used for the sum of the Hive Power and the HIVE in the DHF.
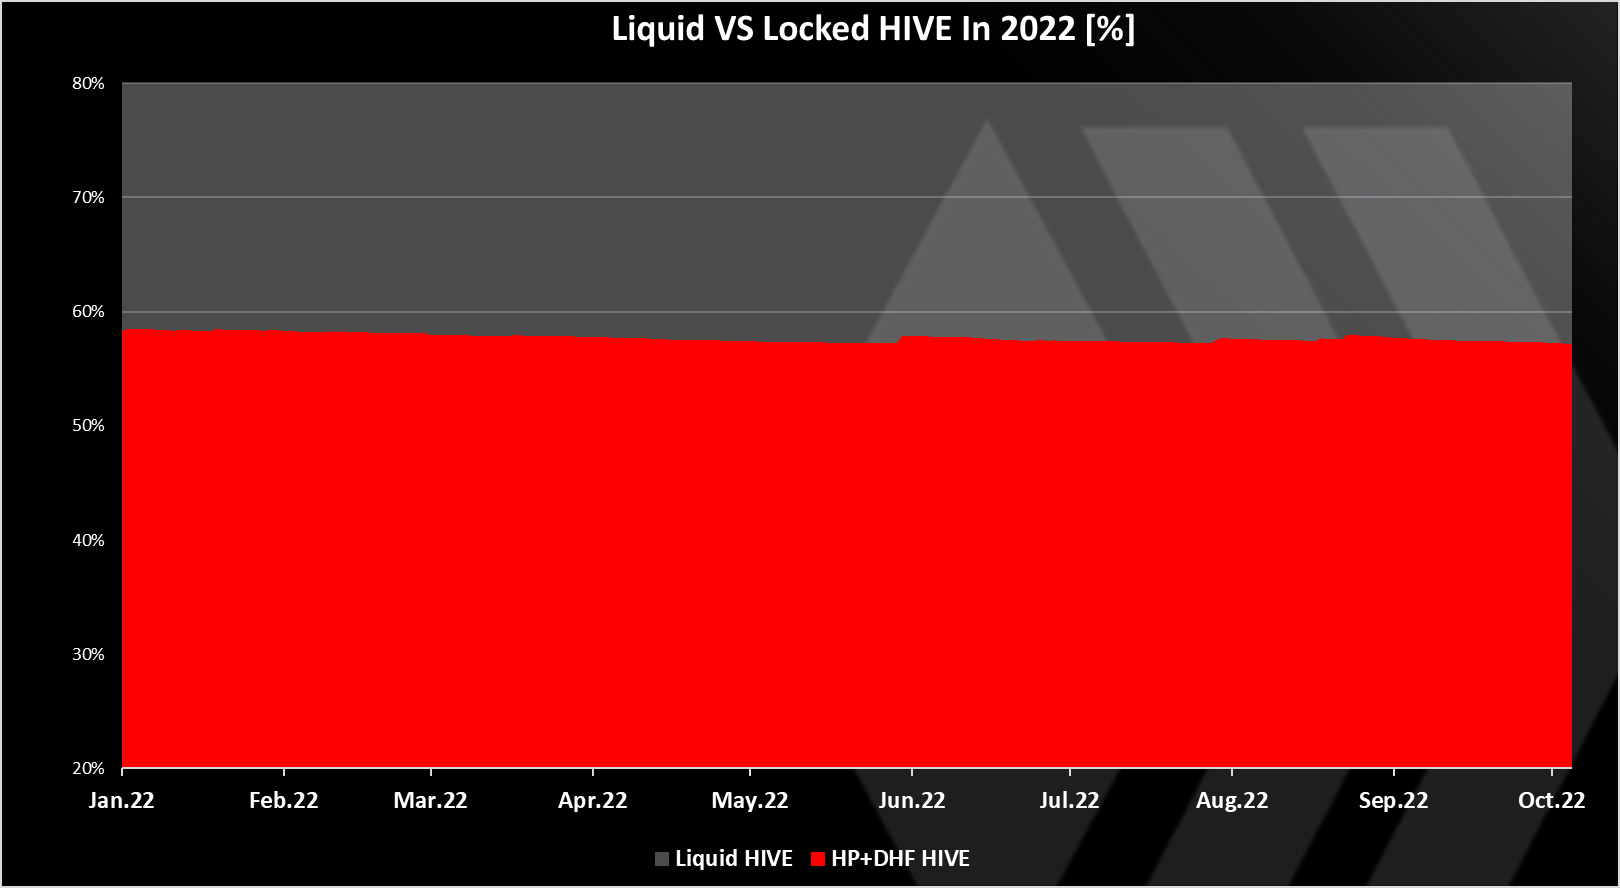
This chart is in relative numbers, to see the evolving share over a period of time.
I have summed up the HP and the HIVE in the DHF for simplicity. We can see that share is almost equal throughout the year with the locked HIVE just bellow 60%, dropping a one or two percent in the year.
Now this is a bit contradictory, since the HP has increased more than the liquid HIVE as we have seen from the above, but this is the case because the HIVE in the DHF that is being converted to HBD. This reduces the overall HIVE supply, but it takes from the locked share. On a yearly basis more than 13M HIVE is removed and converted to HBD.
If we exclude the HIVE in the DHF and its supply, the share of HP has increased for 1%.
HIVE Supply Share
When we plot the current supply on a pie we get this.
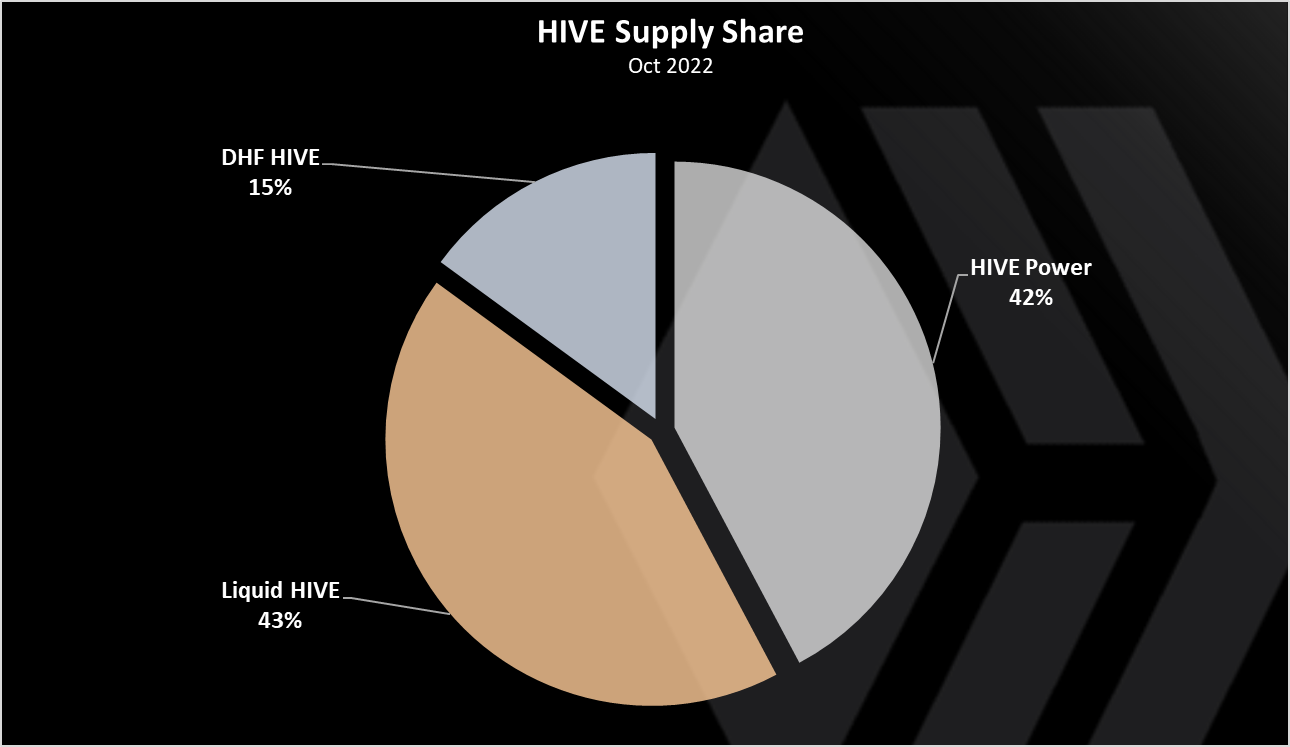
- 42% Hive Power
- 43% Liquid HIVE
- 15% HIVE in the DHF
Having in mind that the HIVE in the DHF is locked we can say that a cumulative of 57% of the HIVE supply is powered up / locked.
Top Accounts That Powered Up
Who is powering up the most?
Here is the chart in September 2022.
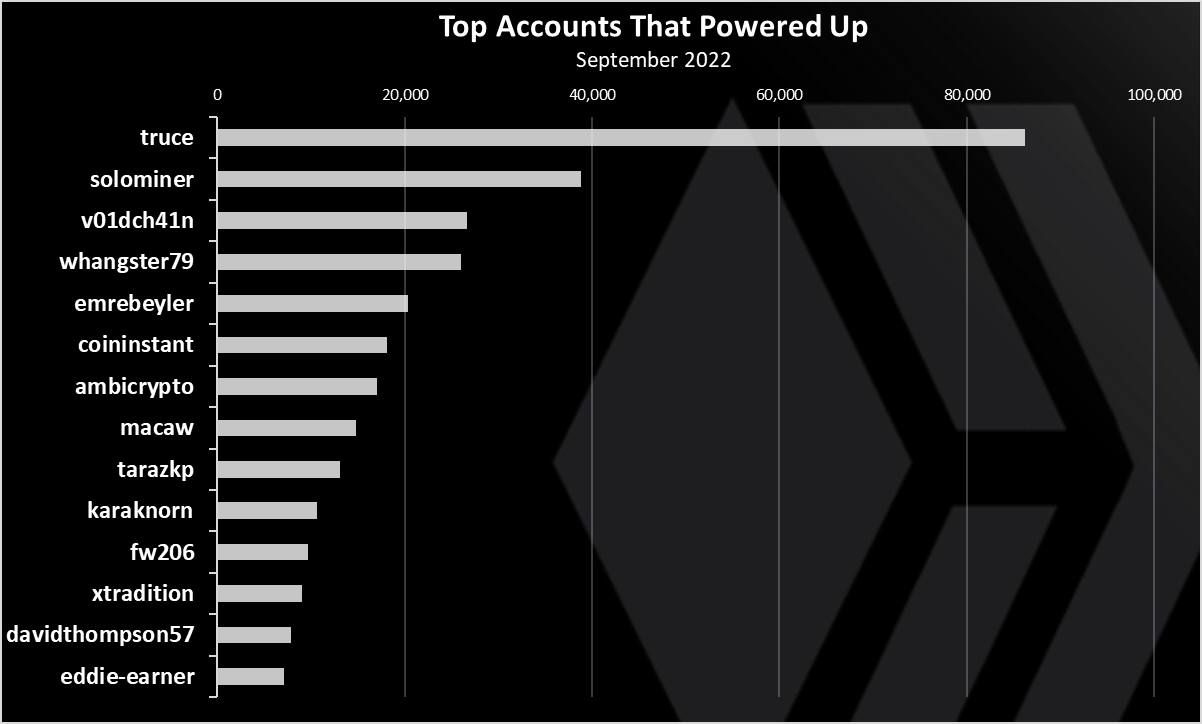
@truce on the top with 86k HP for the month. @solominer second.
Interesting in the previous month August, the official Hive Engine account @honey-swap has powered up 1M HIVE.
Top Accounts That Powered Down
Who is powering down the most?
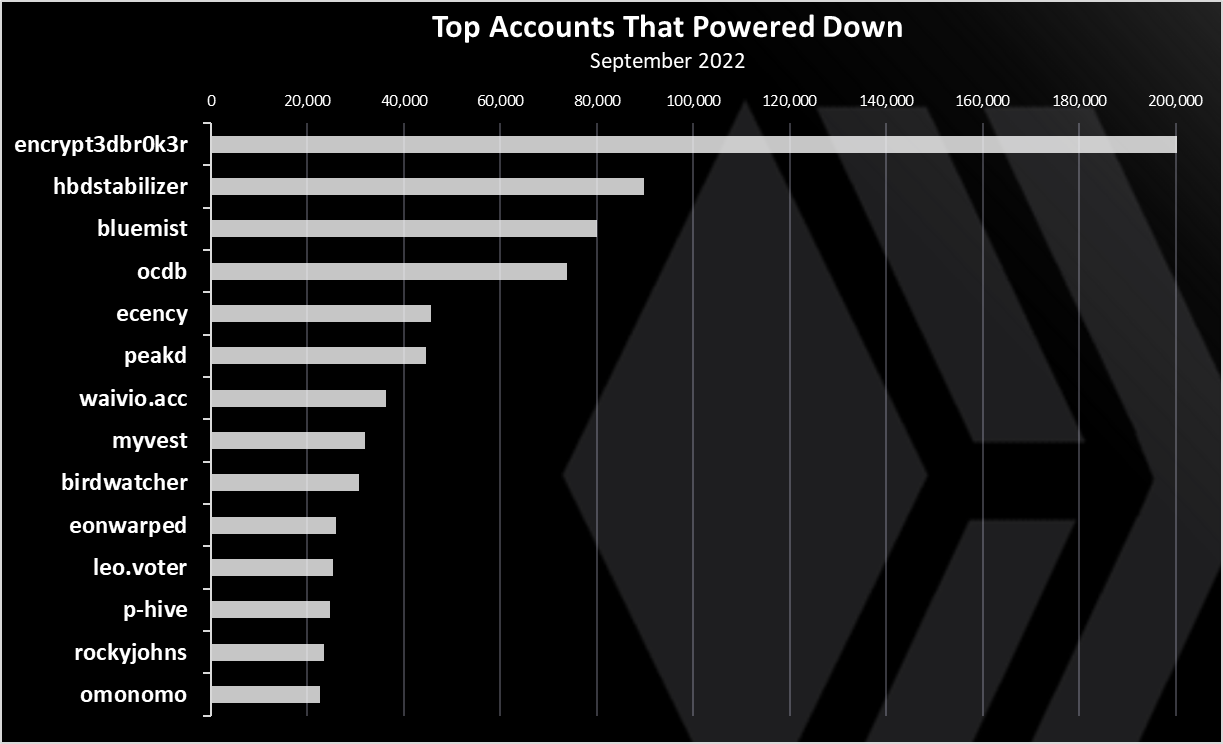
The @encrypt3dbr0k3r account is on the top here with more than 200k HIVE powered down.
The @hbdstabilizer account, that is used as a community project to stabilize the HBD is on the second spot. This account receive daily votes from the top stakeholders and then it is powering it down and send it to the DHF.
As we can see in the last period the amount of HIVE powered up has grown further with May being a record month with more than 4M powered up. Some of the core accounts have been powering up large amounts. Ever since the fork that created the chain back in March 2020, the overall trend has been up. The HIVE supply is expanding, but still more HIVE is being powered up in the process and the Hive Power share has also increased.
Its great to see that overall the community is supporting the project and continue to be vested in, especially when we take into account that HIVE has one of the longest unstaking periods in the industry!
All the best
@dalz
Posted Using LeoFinance Beta
https://twitter.com/Dalz19631657/status/1578492898152448000
https://twitter.com/HashkingsGame/status/1578496150855827456
https://twitter.com/RuelChavez5/status/1578570029779415040
https://twitter.com/bitcoins_get/status/1578753764680683520
https://twitter.com/quase_rico/status/1578765962790457349
https://twitter.com/YanPatrick_/status/1578780100388179968
https://twitter.com/905866971157217280/status/1578964492842459136
https://twitter.com/194045134/status/1579017931480264705
The rewards earned on this comment will go directly to the people( @dalz, @hashkings, @rzc24-nftbbg, @wilsonthe, @michupa, @shiftrox, @mcoinz79, @oliverschmid ) sharing the post on Twitter as long as they are registered with @poshtoken. Sign up at https://hiveposh.com.
Can you plot the % over time? You mentions that the locked up amount is at 57%. It would be interesting to see what it was 6 months ago, 1 year ago, 5 years ago.
This chart shoould do that.
Check the text under it in the post
The power up for the year is really huge and a sign of progress.
Interesting stats and appreciate these posts as it is important to see what is actually happening.
Posted Using LeoFinance Beta
Creating a record is always one to behold...
Shoutout to the Hive Community! 🔥🔥🔥
!PIZZA
PIZZA Holders sent $PIZZA tips in this post's comments:
@bigtakosensei(2/5) tipped @dalz (x1)
You can now send $PIZZA tips in Discord via tip.cc!
half of Hive powered up?! I would call that pretty amazing :)
very interesting graphs which I think paint a quite positive development, thanks!
That's great news. Hive is doing great in this bear market.
Great post
Nice to see that hive power share has increased and the hive supply is expanding...😇
Really useful report ! Great to see a positive trend in power ups !!!
Posted Using LeoFinance Beta
Half way to a whale :-)
.5 whale :)
Congrts on the nice number!