Solana Data | Wallets, Transactions, Fees, Inflation and Supply
The Solana chain has went through a roller coaster ride. It has been one of the main stars of the bull run from 2021, reaching the top 5 in token valuation and a 80 billons market cap. But things have changed a lot and for the worst. Solana was heavily supported by FTX, and the collapse of the exchanges had a major impact on the ecosystem.
Let’s see how are the network activities doing in this period of bear market conditions.
Solana has some unique tech. It is a sort of hybrid between Proof Of Stake (PoS) and a novel concept that they call Proof Of History. There is a lot to say about the proof of history concept, but in short here we will just mention that it is a concept that checks are all the transactions in the right order/sequence. The Solana blockchain works with slots of periods of time, in which the chosen validators confirm the transactions.
Solana has a reputation for one of the fastest blockchains in the history, with a theoretical possible 65k transactions per second. Solana also has a controversial reputation over its decentralization, since it has been put under maintenance and stopped operating a few times in the past.
We will be looking at:
- Active Addresses
- Daily Transactions
- Fees
- Staking and Voting Rewards
- Inflation and Supply
- Market Cap
The period that we are looking into is 2021 to 2023.
The data for the analysis are taken from Dune Analytics, where I have forked existing queries for Solana and adjusted the time frame.
Active Addresses
One of the key metrics for a blockchain is the number of active wallets. Here is the chart.
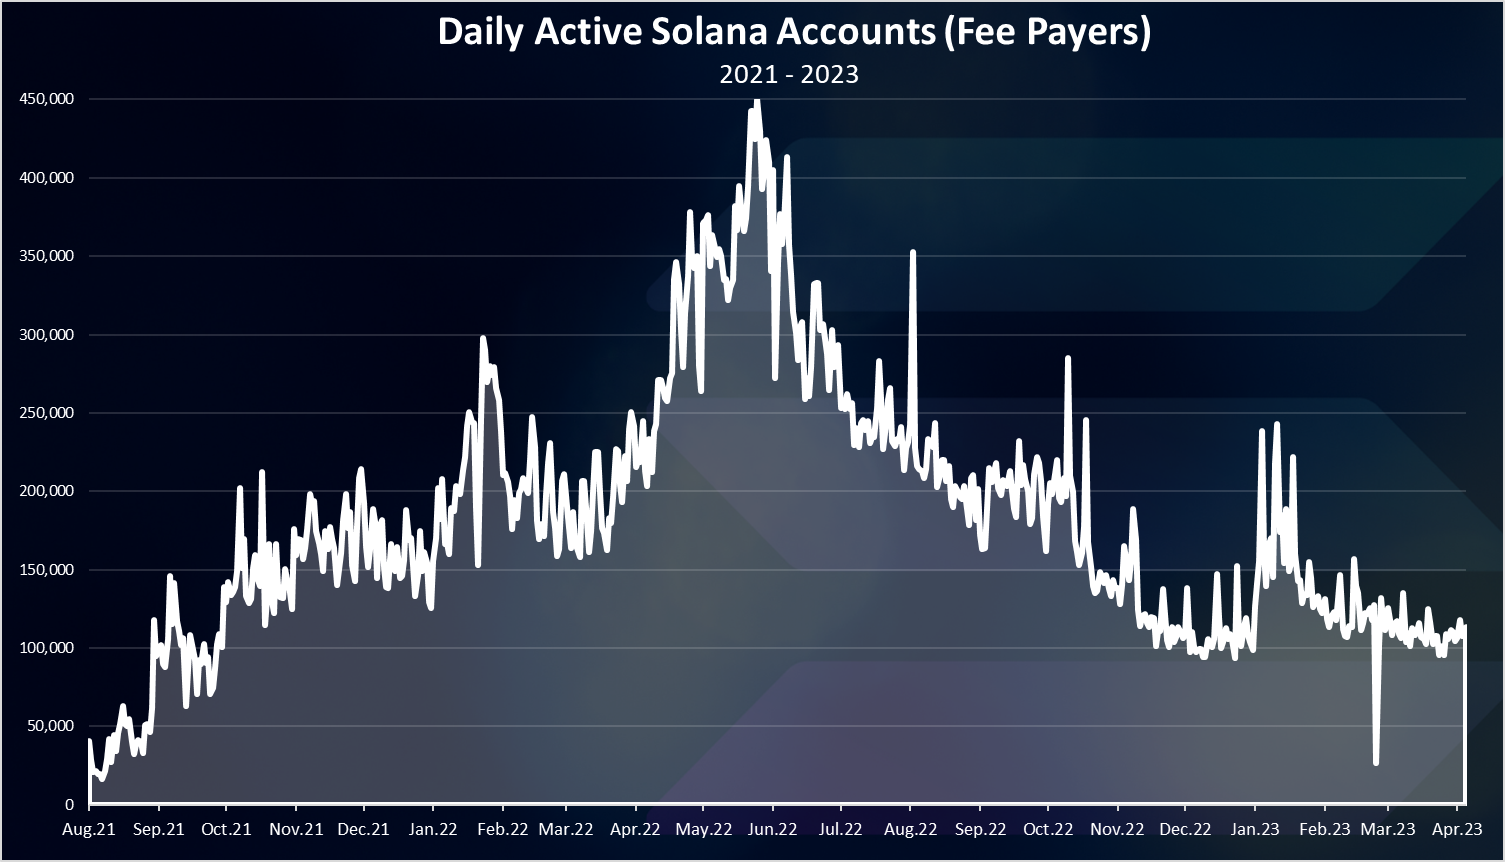
We can notice the peak in the number of active wallets in May 2022 when the ATH was reached of 450k wallets per day. Since then it has been a downtrend for the Solana chain and the current number of DAUs is around 100k.
Daily Transactions
The activity on the networks is mostly represented by the number of daily transactions. Here is the chart.
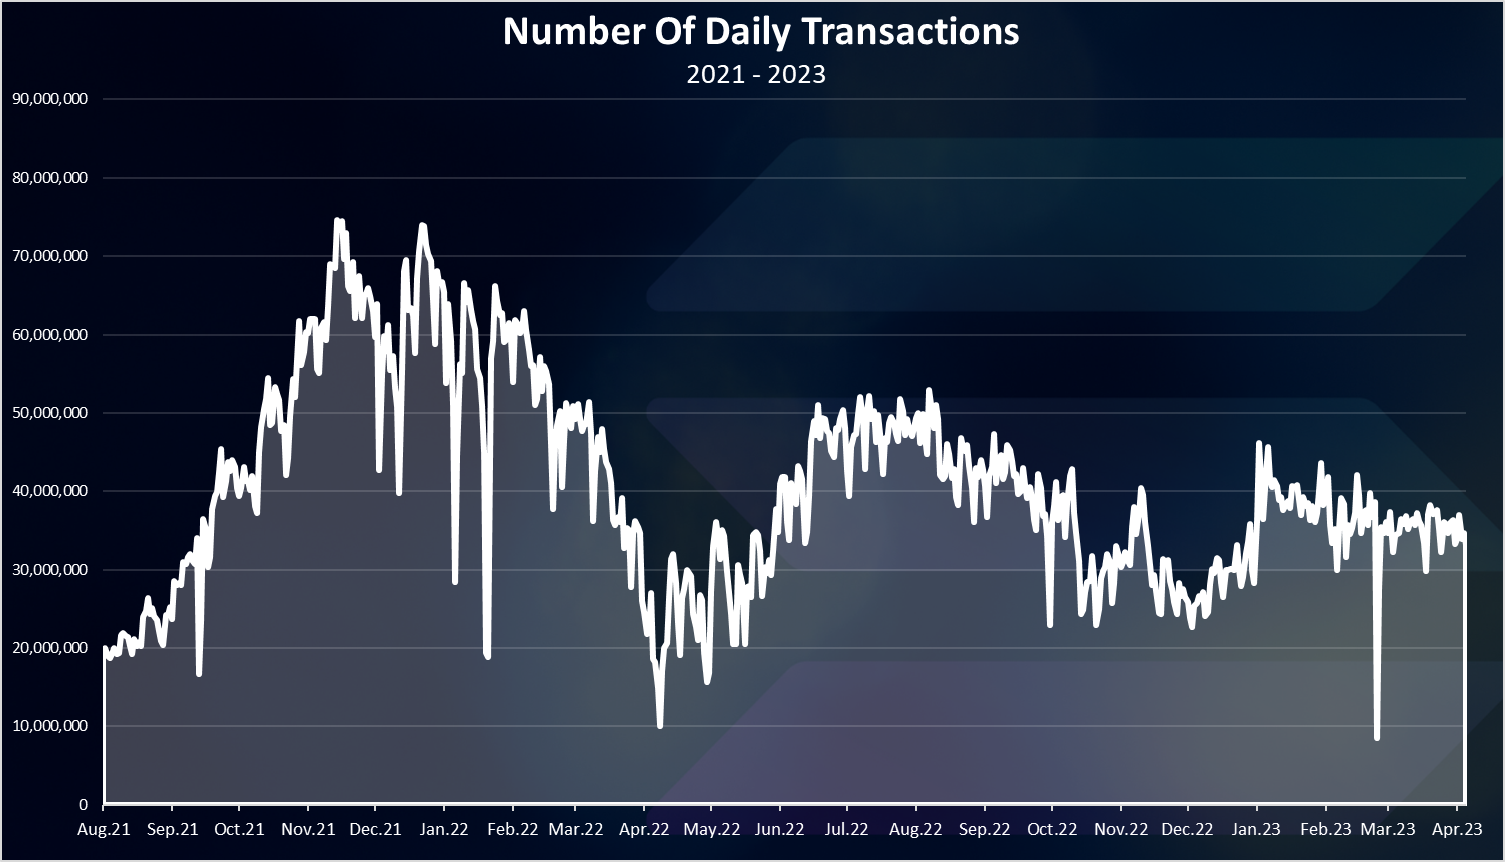
The number of transactions is where Solana shines. It probably holds the record for a number of daily active transactions.
At the peak there was more then 70M transactions per day. In the last period there are between 30M to 40M transactions per day.
Compared to ETH where there is just above 1M, or even Polygon where there is 5M to 10M transactions per day, Solana is leading by a lot.
Fees
Fees are quite the unpopular topic and one of the main reasons for the new EVM chains, as users are trying to find a way to escape ETH high fees.
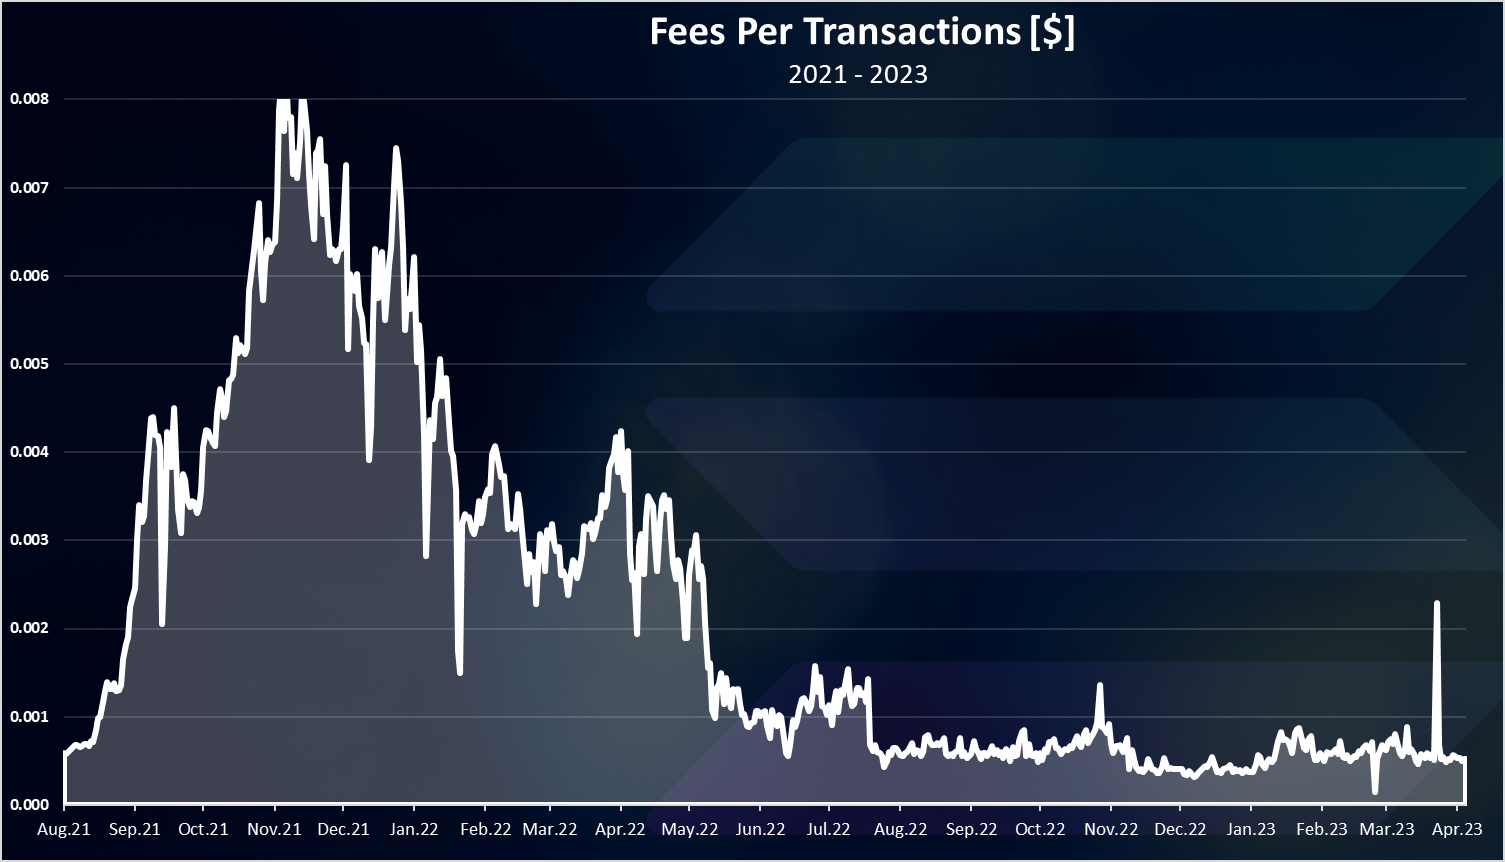
An average fee per transaction per day.
We can notice the uptrend in 2021, with a record high fee in November at the peak of the bull market. In 2022 and 2023 we can a stabilization in the fees with **under $0.001. ** per transactions.
One cent has been the record high for Solana. It’s one of the cheapest blockchain to transact on. Because of the very cheap fees we have seen a lot of botting on the chain, but it still manages the traffic. Thing is the validators need a lot of resources to maintain the speed and the numbers of transactions.
Staking And Voting Rewards
Fees are just one aspect that the Solana validator receive as rewards. There are also staking rewards and voting rewards.
Here are the charts.
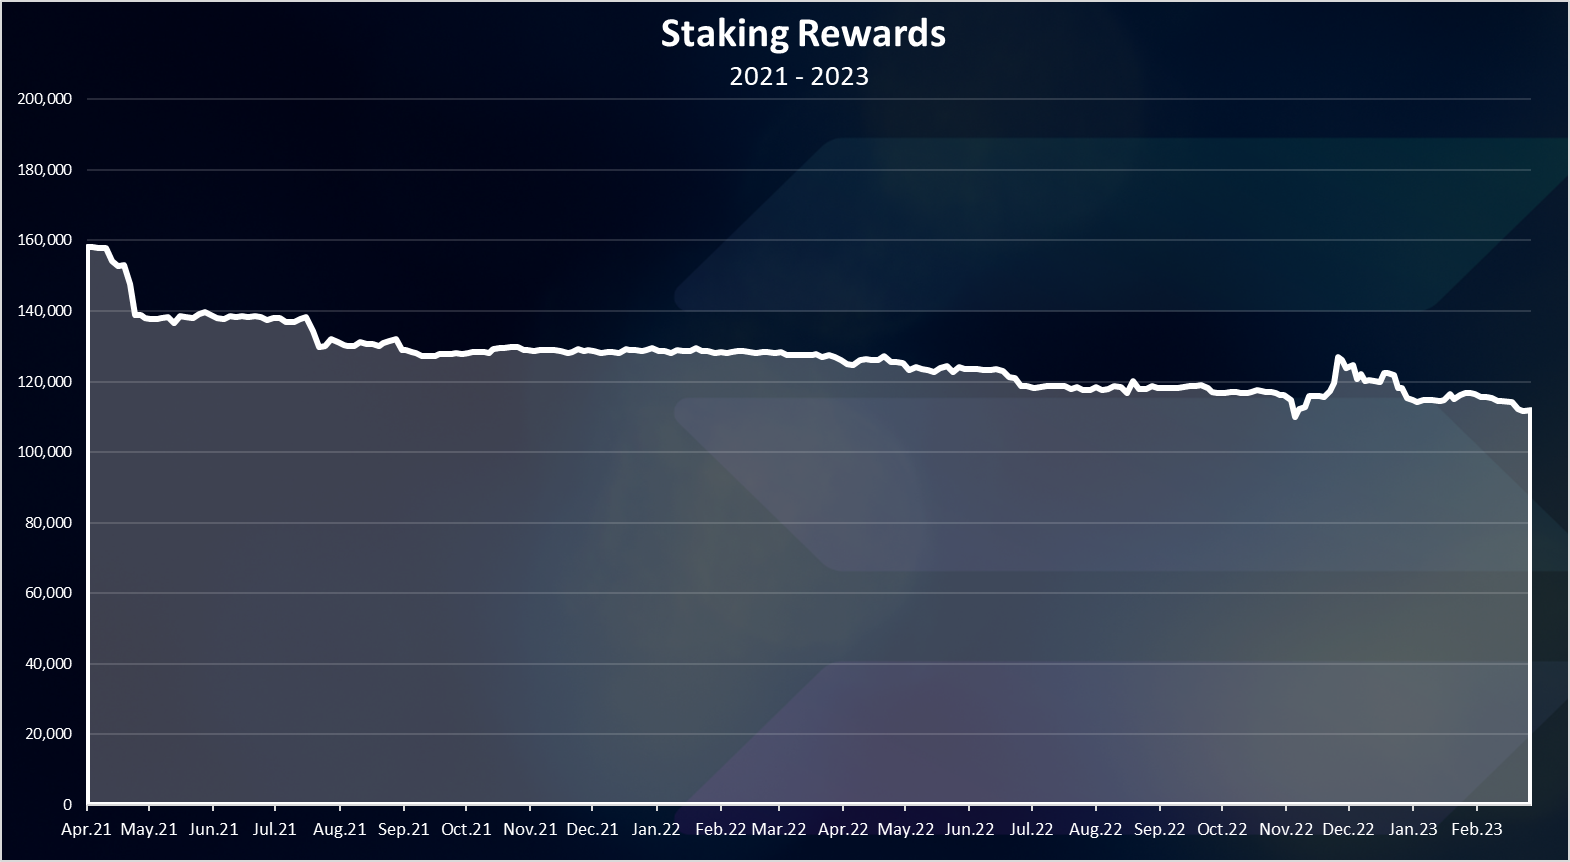
The staking rewards have been quite constant in the period.
Note that these are three days timeframes so, the daily SOL for staking rewards should be around 40k.
The voting rewards looks like this.
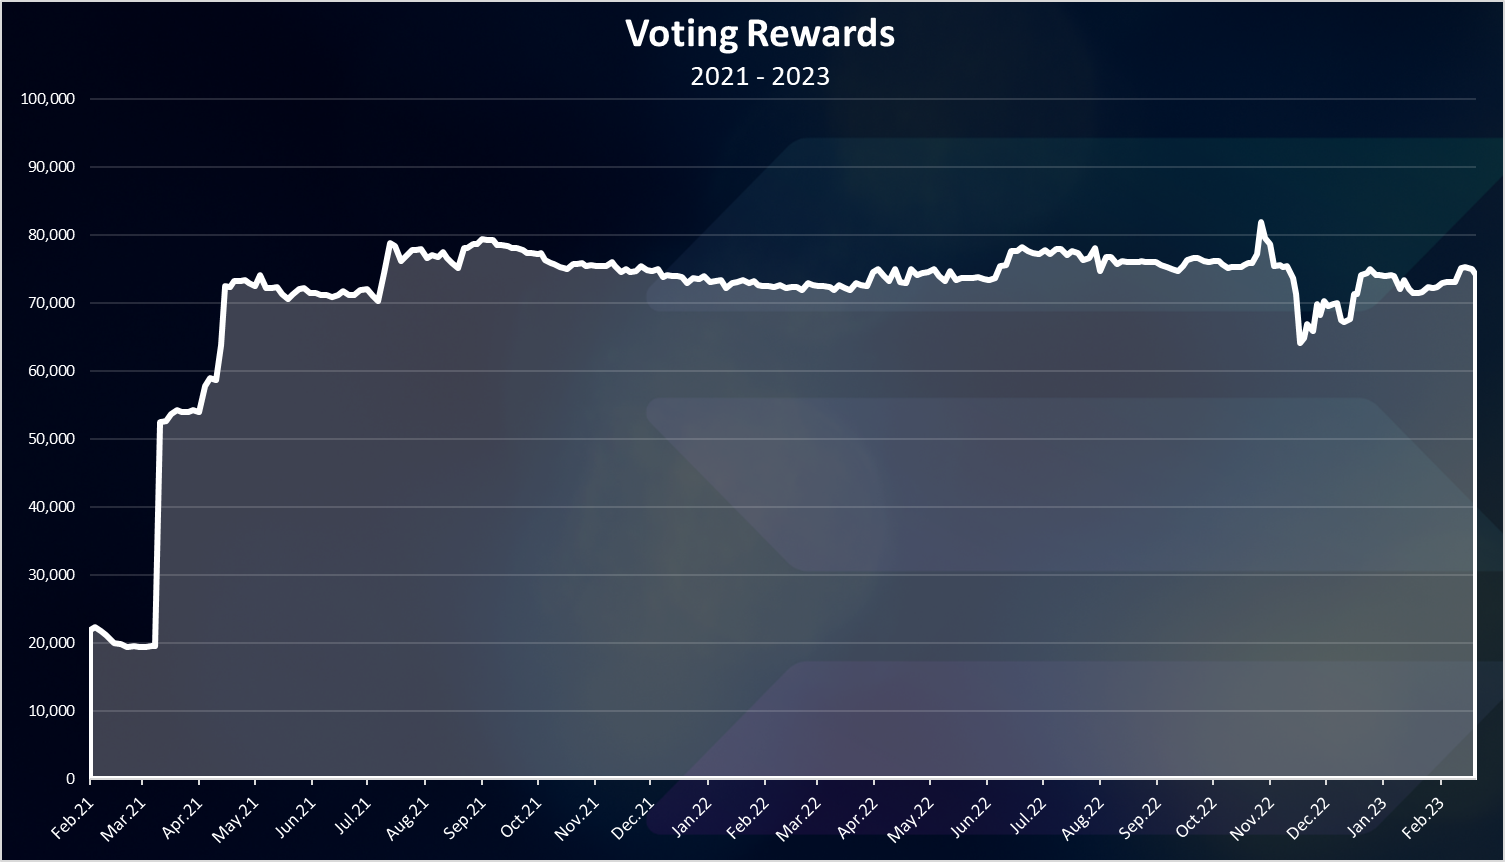
We can see that there has been an increase in the voting rewards in March 2021 and since then they are quite constant with around 75k on a three-day basis (25k per day).
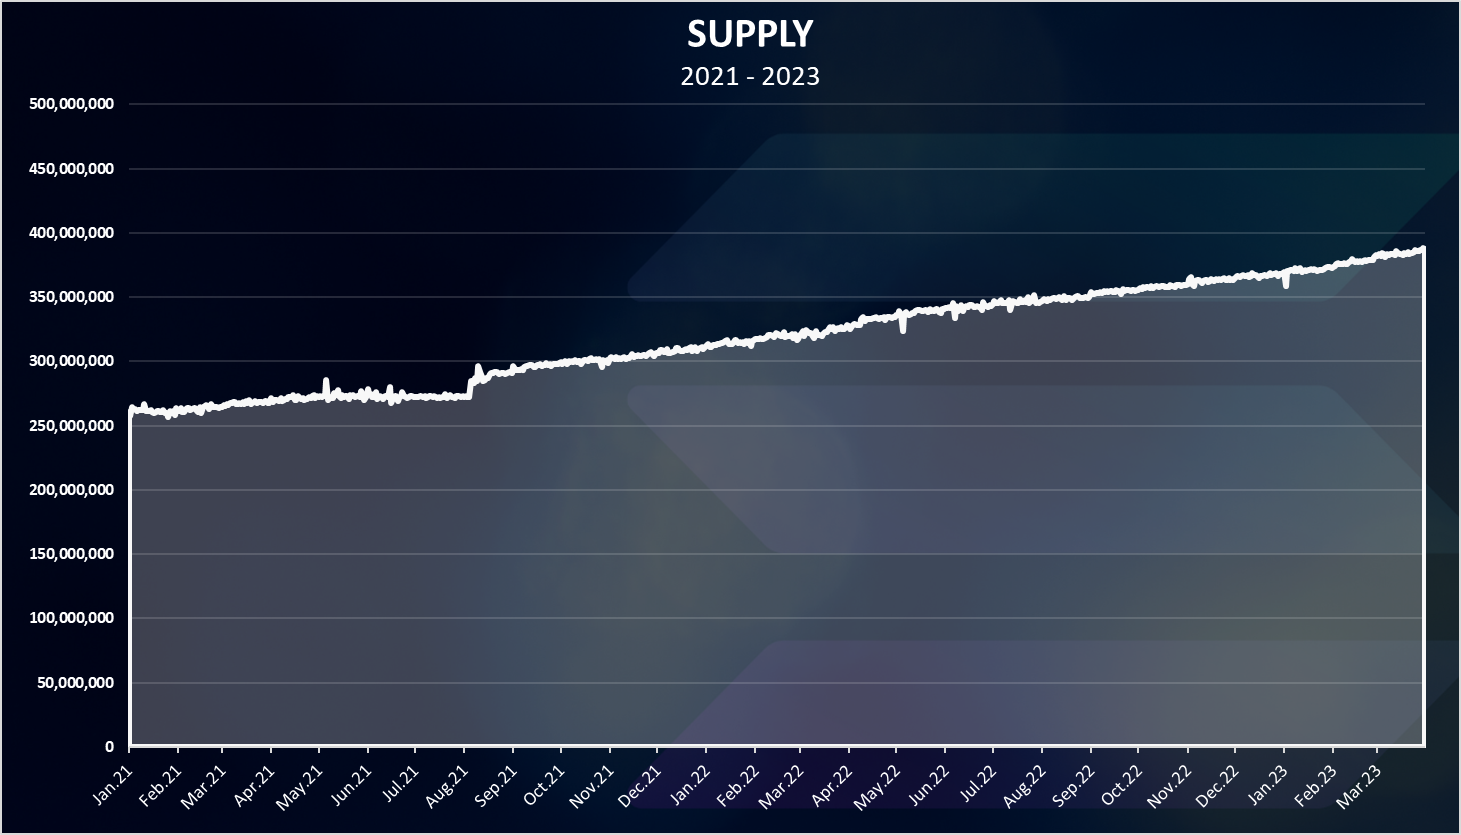
Inflation and Supply
The inflation and supply are on of the most important metrics for a blockchain. Here are the charts from the official Solana docs.
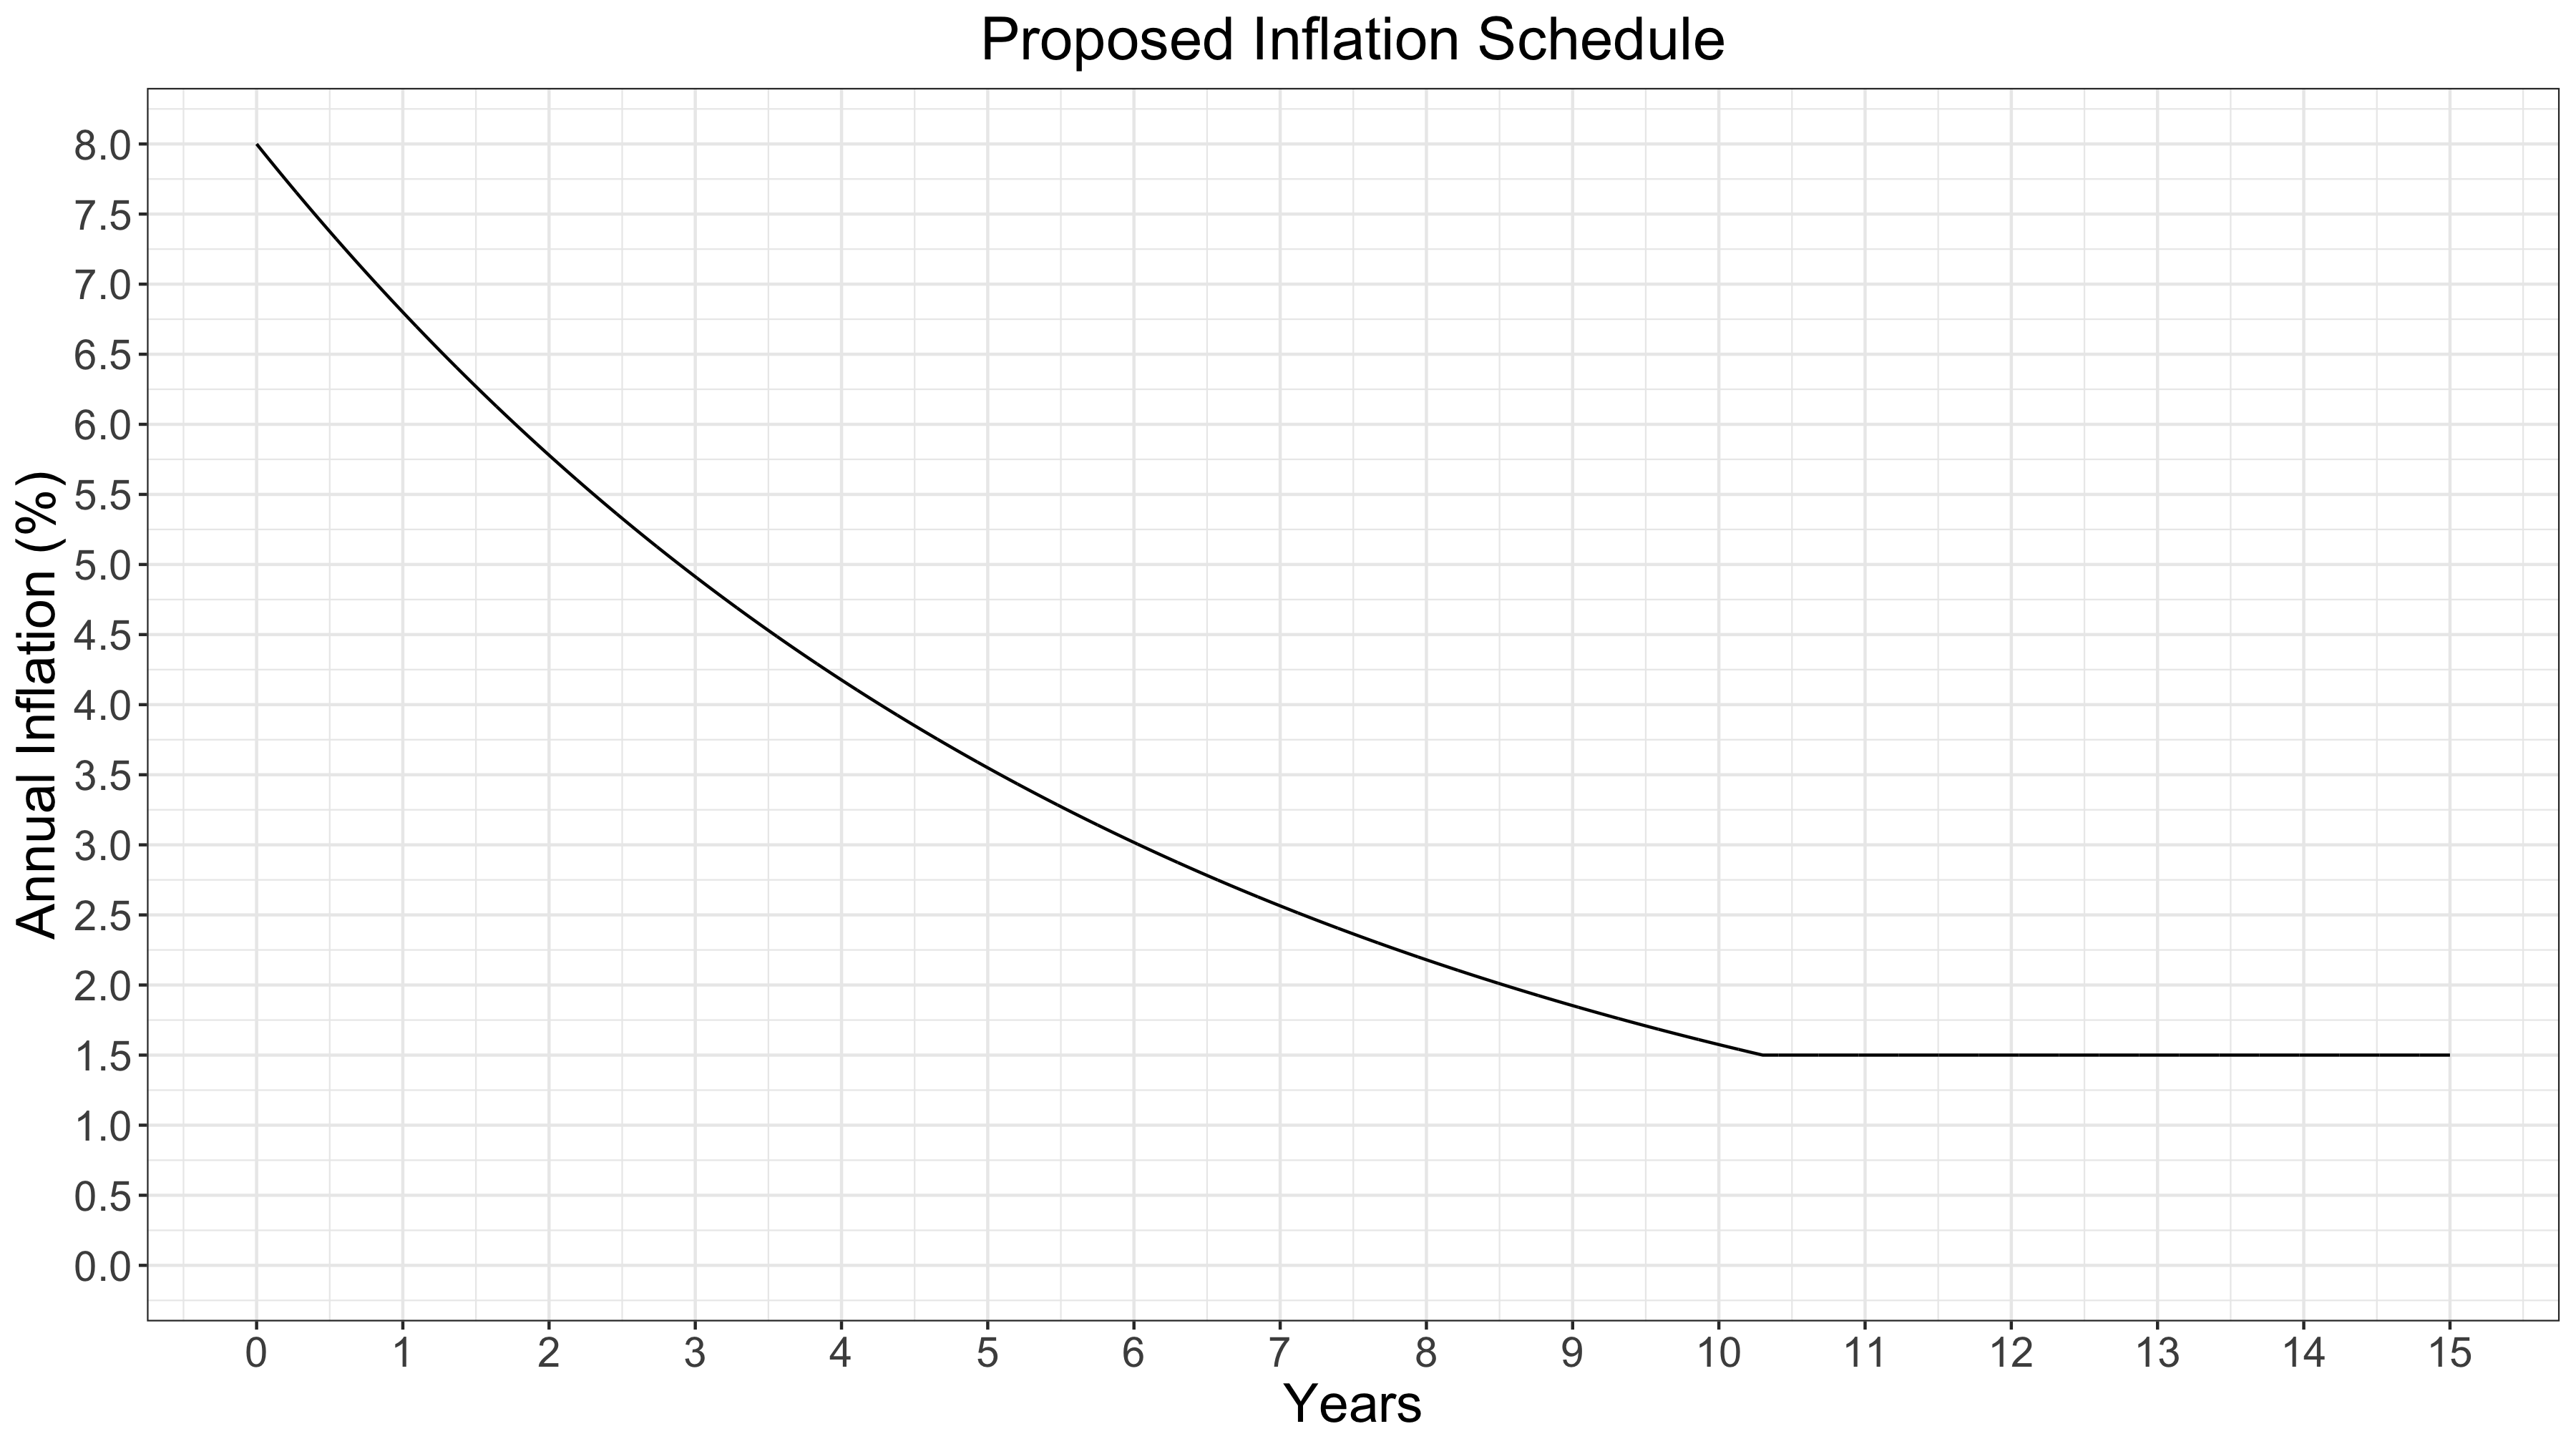
The inflation rate for Solana starts with 8% per year and drops each year, reaching 1.5% after 10 years and stays at that level for the future years.
The supply looks like this.
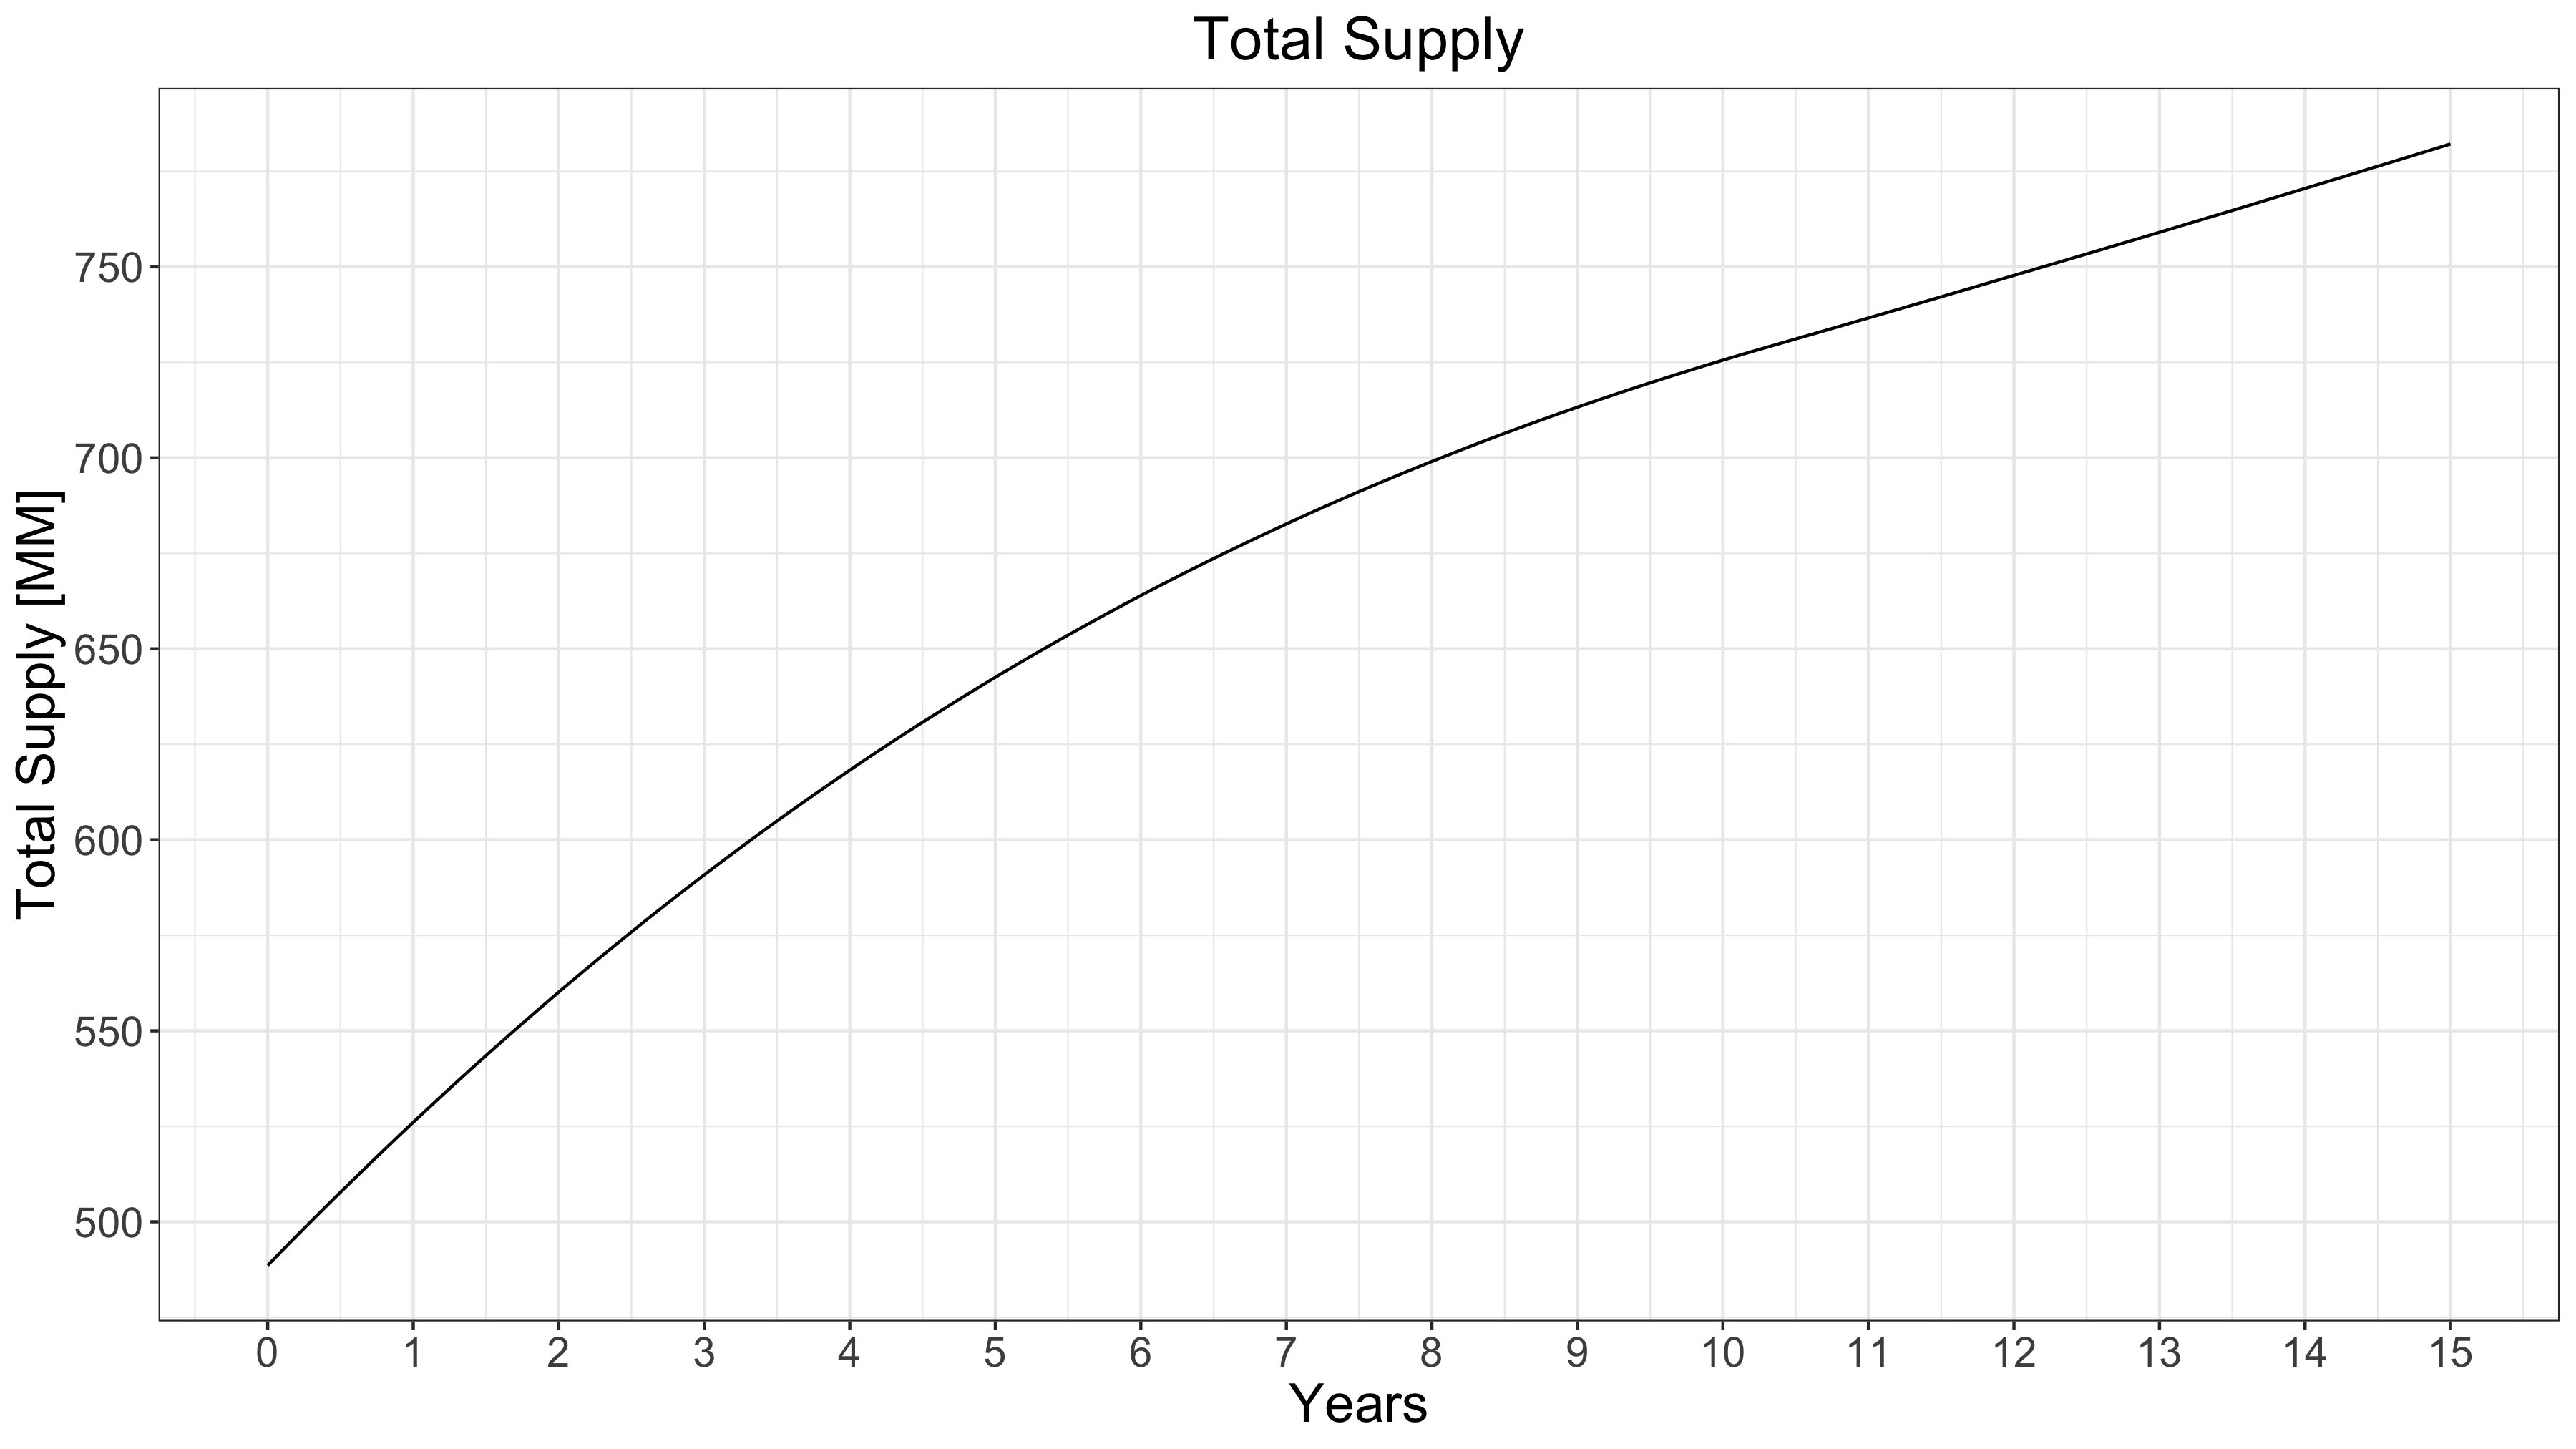
The current supply of Solana is around 390M, but as we can see from the chart it is projected to reach more then 700M in 10 years time. After that the inflation should slow down at 1.5% per year, and the supply should increase slowly.
Market Cap
At the end the chart for the market cap.
At the peak Solana reached an amazing 80B market cap. At the moment the Solana market cap is around 8B or 90% down from the ATH.
While the Solana market cap has dropped 90%, the network activity is down for around 50%. Solana has went through a real turmoil and has dropped a lot, but it is still around the 10th position on the market cap ranking. It remains to be seen will the Solana network be able to come back from this or it will follow the EOS path.
All the best
@dalz
Posted Using LeoFinance Beta
Great analysis Dalz. My only thoughts with Solana are, what would you use it for?! lol
Euphoria is over for Solana. Once the crypto community finds issues, be it UST or FTX fallout they will become wary. I am not saying it will not rise, but the monumental tower is over. And in today's reality, the crypto-verse has become highly competitive.
Anyway, thank you for the stat, it's really informative.
I'm still not sure what to think about this chain. And this has been the case from the begining :)
Solana had many interruptions in 2022, now he seems to be doing a little better. Its ecosystem is large enough, then the SOLANA branded mobile phone will soon have to be released. We'll see. I believe it will be one of those blockchains that will remain standing and will reach 2025
Solana is the go-to platform for real-time, trustless data about blockchain wallets, transactions, fees, inflation, and supply. Through its analysis tools, users can quickly get up-to-date, accurate data about the health of the network.
Thank you for sharing this in-depth look at what Solana did on his network during the bear market. It's interesting to see how this blockchain goes up and down, especially since it was one of the stars of the bull market in 2021. Solana has the most daily trades of any cryptocurrency, even more than Ethereum and Polygon. This is a big deal. The low fees are also a big plus, making it a good choice for people who want to get away from the high fees on other blockchains. Even though network traffic has dropped by about 50%, it is still impressive that Solana is still in the top 10 by market cap, even though it has lost 90% of its value since its all-time high. We still don't know if Solana will be able to get over this and stay a big player in the blockchain space.
The way we saw the FTX in the market was a huge crash which had a huge impact on all the coins and coins it was attached to. I would like to share my opinion here, I still think it will go up again in the coming ball market because people still have trust in it otherwise it would have been completely gone. If his team had given up and fled, he too would have collapsed and the market could have crashed further.
It really took a hard knock.. But then again so did most currencies... I won't mind for a roll back😂🍥 Hive was real cheap I'd like to buy in
Solana is getting better day by day, though they had a hard previous year, now they are back on the track, 40m transactions per day is a big thing and they are also offering low transaction fees as compared to Eth.
Es un gran proyecto, muy solido entre las primeras cripto del mundo.