Everything you need to know about the MACD indicator (EN-ES)
Created in Canva
English
When trading in the markets and establishing a scheme adapted to the trader's convenience, certain conditions to be fulfilled are implemented, for the execution of a "proper" entry. Identify which elements can support your trading for better performance and readability. Select a set of indicators, tools or patterns executed by the trader in order to obtain clues for the next possible market movements. For this this opportunity I will explain in detail the basic fundamentals of the MACD, a complex and effective momentum indicator.
What is the MACD? Composition and Fundamental Characteristics.

The MACD (Moving Average Convergence) is a multifunctional momentum indicator, which allows us to identify trend formation and reversals. In addition, thanks to all the components it contains, we can also note the strength of the trend, regardless of the timeframe in which the asset is displayed. At any time. The MACD also includes many elements that make it The MACD also includes many elements that make it a versatile and easy to handle indicator.
Designed by Gerald Appel and currently used by a large number of operators.
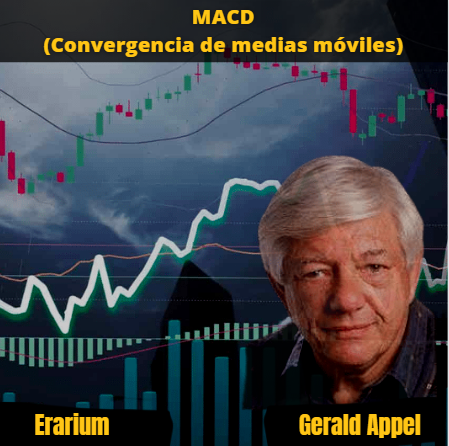
Image created on the platform Canva
Composition and characteristics of the MACD.
The MACD is composed of the following characteristics:
MACD line: this line consists of two exponential moving averages (EMA) of 26 and 12 periods, the subtraction of these two lines in itself forms the MACD line which is usually shown on the chart and in most cases are colored blue.
Signal line: this line consists of a 9-period exponential moving average (EMA) and is usually depicted in red on the chart. Like the MACD line, this is very important and provides key reversal signals along with the MACD line as a reference.
Histogram: The histogram is a very crucial tool that the MACD indicator has, it can reflect the strength of the trend in it, and it can also give us very good signals even before the MACD line and signal lines give us a reversal signal. Cua Any financial activity.
Line 0: This line represents the center of the MACD indicator, which is a fundamental component of the indicator, since depending on the polarity of the MACD and the signal lines, the current trend of the MACD can be determined. What is the property. A furthermore, it can provide reversal and/or trend continuation signals as it interacts with the MACD and signal lines.

Capture of AVATRADE
Which hat is the correct configuration for each operation?
Here are a number of basic settings in this index that will allow us to perform buy/sell activities in the market. So I will now explain each one below:
Through the MACD line with a signal line:
If you wish, this is the default configuration that we can use using the MACD. Its work is complex, we just have to wait until the intersection between these two lines can buy or sell in the market. In this sense, if we are looking for "buy" activity, we must wait that in the lower area of the chart, the MACD line crosses from below with upward direction to the signal line, this will indicate that a new uptrend may begin, we must also take very much into account that the MACD line (Blue), is above the signal line (Red), for this entry to be valid.
Crossing of the MACD line and the Signal line, with the ZERO line:.
Another of the configurations that we will be able to use, is the famous crossing of the MACD and Signal lines, with the average line ( ZERO ) that our indicator has. Its operation is very simple, we must only wait until after these make their usual crossing, discussed in the previous part, these must simultaneously cross the ZERO line, giving us another signal of entry to the market in the direction we are working. Something to keep in mind, this signal is more delayed than the others, but we can interpret it as that the movement we are seeing has more strength.
The Histogram and its benefits.
The histogram is another tool that we can use to our benefit. Its operation is very simple and can provide us with one of the best signals that, in my opinion, this indicator has, since it basically comes before all the others. The histogram shows us green and red bars, depending on the direction that the price has at that moment, these represent the strength of the movement, then, while a movement is getting stronger, it means that the bars grow in size and the opposite happens. if the movement weakens, as the bars tend to decrease in size. When we can identify that a move is weakening, this can give us a clear reversal signal, because it is warning us that the price may be turning around, which can allow us to enter before it happens, something that happens before the conventional crossover. of the MACD and signal lines.
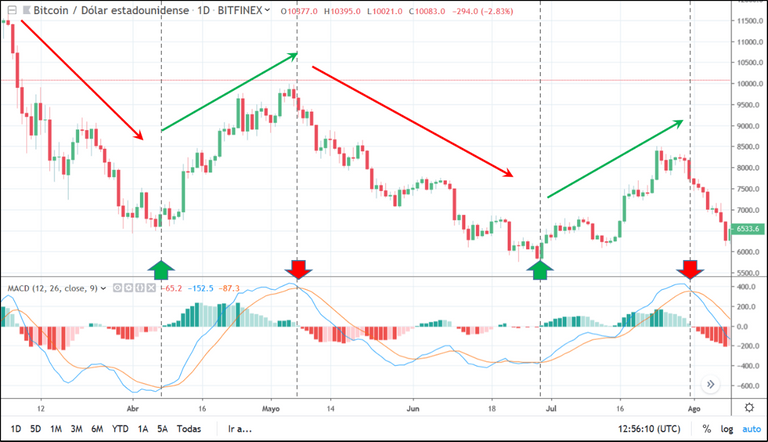
Trading with MACD divergences.
The last setup we can use with the MACD, is that we can identify the famous divergences. It can often be difficult to find such signals, but if we sharpen our eyes on the chart, we can notice the details that do not leave the price and then, we can enter a trade with the odds in our favor. In this sense, to identify a divergence, we just have to look at our chart, if, for example, the asset we are analyzing has an uptrend and is making higher and higher highs and we look at the time our MACD and see that our MACD lines and signal are making lower and lower lows, this means that the uptrend is weakening, so the best probability is that the price reverses and this may be the signal for us to reverse in the opposite direction and take advantage of this movement.
How to detect a trend using the MACD?
Detect trends with this indicator, is another of the many utilities that I have already told you previously. Although I will be very specific on this point, since my research led me to the fact that there are only a few ways to do it and take advantage of it so that we can benefit from it. In this sense, trends can be formed in many temporalities and we can always see that these are different depending on the temporality we are working with.
Capture of AVATRADE
Line crossing: The famous line crossing that I have already discussed in the past, is a way to detect the new trends that the price is forming, in the different temporalities that we work with.
The lines above the ZERO line: Another way to detect an ongoing trend and not since its inception, is to observe when the MACD lines and the SIGNAL line are above the ZERO line and also manage to stay for a certain time above it. This means that the trend is sustained and strong.
How to filter out false signals?
To filter out the false signals, I have my own ideology or if you can say, strategy, of how to do it, since, in itself the indicator does not have a tool that allows us to filter out the signals that we should not take and those that would very possibly go against a well-defined trend. So to identify these false signals we must take into account the following:
Use moving averages or another oscillator that allows us to identify trends: Moving averages can allow us in any temporality, to filter a trend, if we are not very sure of the strongest direction that the price has. For example, we can use a "SMA" of 350 periods, and determine on which side is the price, if it is below the moving average, the trend is bearish, if on the contrary it is above it is bullish. In this sense, in either scenario, we will only take MACD signals that are in the direction of the dominant trend.
The higher the time frame, the more reliable: Another technique that can be very useful, but is only made for traders who have patience, is to use higher time frames, these time frames will allow us to easily observe the general direction of the price. and we should only take MACD signals that are in the direction of the general trend.
Filtering out false signals with higher seasonalities - Tradingview screenshots
How can the MACD indicator be used to extract support and resistance points or levels on the chart?
Using the MACD, to be able to identify support or resistance, is very useful and simple and we only have to take into account certain aspects, to be able to refine our view and determine these points on the chart. To do so, we only need to follow We only need to follow the recommendations I am going to describe below:
To observe carefully where the MACD and SIGNAL lines are located, make an inversion and then touch the same point again, avoiding the lines to move in one direction or another. To be clearer, is to observe the path of these lines and determine at what points it turns around, once this is done, we go to our chart and the price should be held by an area, which is the price ( Japanese candlesticks ) , has not been able to cross. This approach must be simultaneous, both on the chart and on the MACD indicator, with this we will realize if it is a valid support or resistance to take into account.
Conclusion
The MACD is a complete tool for multiple scenarios, timeframes and applies to a large number of financial assets. It has great acceptance for its great effectiveness in showing signals to perform a buy/sell operation, I consider it a very good indicator to implement to the operation.

Español
Al momento de comercializar en los mercados y establecer un esquema adaptado a la comodidad del operador, se implementan ciertas condiciones a cumplir, para la ejecución de una entrada "adecuada". Identificar que elementos pueden respaldar tu operativa para obtener un mayor rendimiento y legibilidad. Seleccionar un conjunto de indicadores, herramientas o patrones ejecutados por el trader con la finalidad de obtener indicios para los próximos posibles movimientos del mercado. Para esta oportunidad explicaré de manera detallada los fundamentos basicos del MACD, un indicador de momentum, complejo y eficaz.
¿Que es el MACD? Composicion y Caracteristicas Fundamentales.
El MACD (Convergencia de medias móviles) es un indicador de momentum multifuncional, que nos permite identificar la formación de tendencias y sus reversiones. Además, gracias a todos los componentes que contiene, también podemos notar la fuerza de la tendencia, sin importar la temporalidad en la que se visualice el activo. En cualquier momento. El MACD también incluye muchos elementos que lo convierten en un indicador versátil y fácil de manejar.
Diseñado por Gerald Appel y utilizado actualmente por una gran cantidad de operadores.
Imagen creada en la plataforma Canva
Composición y características del MACD.
El MACD se compone por las siguientes características:
Línea MACD: esta línea consta de dos promedios móviles exponenciales (EMA) de 26 y 12 períodos, la resta de estas dos líneas en sí misma forma la línea MACD que generalmente se muestra en el gráfico que en la mayoría de los casos tienen el color azul.
Línea de señal: esta línea consta de una media móvil exponencial (EMA) de 9 períodos y, por lo general, se representa en rojo en el gráfico. Al igual que la línea MACD, esto es muy importante y proporciona señales clave de reversión junto con la línea MACD como referencia.
Histograma: El histograma es una herramienta muy crucial que tiene el indicador MACD, puede reflejar la fuerza de la tendencia en él, y también puede darnos muy buenas señales incluso antes de que la línea MACD y las líneas de señal nos den una señal de reversión. Cualquier actividad financiera.
Línea 0: Esta línea representa el centro del indicador MACD, el cual es un componente fundamental del mismo, ya que dependiendo de la polaridad del MACD y de las líneas de señal se puede determinar la tendencia actual del MACD. Cuál es la propiedad. Además, puede proporcionar señales de inversión y/o continuación de tendencia a medida que interactúa con el MACD y las líneas de señal.
Capture of AVATRADE
¿Cuál es la configuración correcta para cada operativa?
Hay una serie de configuraciones básicas en este índice que nos permitirán realizar actividades de compra/venta en el mercado. Entonces paso a explicar cada una a continuación:
A través de la línea MACD con línea de señal:
Si lo desea, esta es la configuración por defecto que podemos utilizar usando el MACD. Su trabajo es complejo, solo tenemos que esperar hasta que la intersección entre estas dos líneas pueda comprar o vender en el mercado. En este sentido, si buscamos la actividad de "comprar", debemos esperar que en la zona inferior del gráfico, la línea MACD se cruce de abajo con dirección ascendente a la línea de señal, esto indicará que puede comenzar una nueva tendencia alcista, también debemos tener muy en cuenta que la línea MACD (Azul), está por encima de la línea de señal (Roja), para que esta entrada sea válida.
Cruce de las líneas MACD y la línea Signal, con la línea ZERO:
Otra de las configuraciones que podremos utilizar, es el famoso cruce de las líneas del MACD y señal, con la línea media ( ZERO ) que tiene nuestro indicador. Su funcionamiento es muy sencillo, solo debemos esperar a que luego de que estos realicen su cruce habitual, comentado en la parte anterior, estos deben cruzar simultáneamente la línea CERO, dándonos otra señal de entrada al mercado en la dirección que estamos trabajando. Algo hay que tener en cuenta, esta señal va más retrasada que las demás, pero podemos interpretarlo como que el movimiento que estamos viendo tiene más fuerza.
El Histograma y sus beneficios
El histograma es otra herramienta que podemos utilizar en nuestro beneficio. Su funcionamiento es muy sencillo y nos puede proporcionar una de las mejores señales que, en mi opinión, tiene este indicador, ya que básicamente se antepone a todos los demás. El histograma nos muestra barras verdes y rojas, dependiendo de la dirección que tenga el precio en ese momento, estas representan la fuerza del movimiento, entonces, mientras un movimiento se va haciendo más fuerte, significa que las barras crecen en tamaño y sucede lo contrario. si el movimiento se debilita, ya que las barras tienden a disminuir de tamaño. Cuando podemos identificar que un movimiento se está debilitando, esto nos puede dar una señal clara de reversión, porque nos está advirtiendo que el precio puede estar dando la vuelta, lo que nos puede permitir entrar antes de que suceda, algo que sucede antes del cruce convencional. del MACD y líneas de señal.
Operar con las divergencias del MACD
La última configuración que podemos usar con el MACD, es que podemos identificar las famosas divergencias. A menudo puede ser difícil encontrar tales señales, pero si aguzamos la vista en el gráfico, podemos darnos cuenta de los detalles que no dejan el precio y luego, podemos ingresar a una operación con las probabilidades a nuestro favor. En este sentido, para identificar una divergencia, solo tenemos que mirar nuestro gráfico, si, por ejemplo, el activo que estamos analizando tiene una tendencia alcista y está haciendo máximos cada vez más altos y miramos el tiempo nuestro MACD y vemos que nuestras líneas y señal MACD están haciendo mínimos cada vez más bajos, esto significa que la tendencia alcista se está debilitando, por lo que la mejor probabilidad es que el precio se revierta y esta puede ser la señal para que invirtamos en la dirección opuesta y aprovechemos Este movimiento.
¿Cómo detectar una tendencia utilizando el MACD?
Detectar tendencias con este indicador, es otra de las tantas utilidades que ya os he comentado anteriormente. Aunque seré muy específico en este punto, ya que mi investigación me llevó a que solo hay unas pocas formas de hacerlo y aprovecharlo para que podamos beneficiarnos de él. En este sentido, se pueden formar tendencias en muchas temporalidades y siempre podemos ver que estas son diferentes dependiendo de la temporalidad con la que estemos trabajando.
Capture of AVATRADE
Cruce de líneas: El famoso cruce de líneas que ya he comentado en el pasado, es una forma de detectar las nuevas tendencias que va formando el precio, en las diferentes temporalidades que trabajamos.
Las líneas por encima de la línea CERO: Otra forma de detectar una tendencia en curso y no desde su inicio, es observar cuando las líneas MACD y la línea SEÑAL están por encima de la línea CERO y además consiguen mantenerse durante un tiempo determinado por encima de ella. Esto significa que la tendencia se mantiene y es fuerte.
¿Cómo filtrar las señales falsas?
Para filtrar las señales falsas, tengo mi propia ideología o si se puede decir, estrategia, de cómo hacerlo, ya que, en sí mismo el indicador no tiene una herramienta que nos permita filtrar las señales que no debemos tomar y esas que muy posiblemente iría en contra de una tendencia bien definida. Así que para identificar estas señales falsas debemos tener en cuenta lo siguiente:
Utilizar medias móviles u otro oscilador que permita identificar tendencias: Las medias móviles nos pueden permitir en cualquier temporalidad, filtrar una tendencia, si no estamos muy seguros de la dirección más fuerte que tiene el precio. Por ejemplo, podemos utilizar una "SMA" de 350 periodos, y determinar de qué lado está el precio, si está por debajo de la media móvil, la tendencia es bajista, si por el contrario está por encima es alcista. En este sentido, en cualquiera de los dos escenarios, solo tomaremos las señales del MACD que estén en la dirección de la tendencia dominante.
Cuanto mayor sea el marco de tiempo, más confiable: Otra técnica que puede ser muy útil, pero que solo está hecha para los comerciantes que tienen paciencia, es usar marcos de tiempo más altos, estos marcos de tiempo nos permitirán observar fácilmente la dirección general del precio. y solo debemos tomar señales MACD que estén en la dirección de la tendencia general.
Filtrado de señales falsas con temporalidades más altas - Capturas de pantalla de Tradingview
¿Cómo se puede usar el indicador MACD para extraer puntos o niveles de soporte y resistencia en el gráfico?
Usar el MACD, para poder identificar soportes o resistencias, es muy útil y sencillo y solo debemos tener en cuenta ciertos aspectos, para poder afinar nuestra vista y determinar estos puntos en el gráfico. Para ello solo debemos seguir las recomendaciones que voy a describir a continuación:
Para observar con atención donde se encuentran las líneas MACD y SIGNAL, haga una inversión y luego vuelva a tocar el mismo punto, evitando que las líneas se muevan en un sentido u otro. Para ser más claro, es observar el camino de estas líneas y determinar en qué puntos da la vuelta, una vez hecho esto, vamos a nuestro gráfico y el precio debería estar retenido por un área, que es el precio ( velas japonesas ) , no ha podido cruzar. Este acercamiento debe ser simultáneo, tanto en el gráfico como en el indicador MACD, con esto nos daremos cuenta si es un soporte o resistencia válida a tener en cuenta.
Conclusión
El MACD es una herramienta completa para múltiples escenarios, temporalidades y aplica para una alta cantidad de activos financieros. Posee gran aceptación por su gran efectividad a la hora de mostrar señales para realizar una operación de compra/venta considero que es un indicador muy bueno para implementar a la operativa.