Institutional Trading and Order Blocks (EN-ES)

Imagen creada en la plataforma Canva
English
Nowadays, "Trading" is a popular profession exercised by many people in search of financial freedom, to generate extra income or to use it for retirement savings. It is a stock market negotiation based on the speculation of financial assets with the purpose of obtaining a profit. Part of the fundamentals of trading is technical analysis, fundamental analysis, risk management and personally designed strategies to realize a trade. There is a wide variety of determining factors which can be coupled to our way of trading: Seasonality, indicators, patterns, etc. What really matters is the crucial basis of market direction. The supply and demand driven path, liquidity zones and where interest from institutions or retailers is located.
In this way, the explanatory development of this publication "Institutional trading" is predicted to cover in a straightforward manner the main ideal that a "trader" should handle to start trading.
Basic concepts of institutional trading and its function, main characteristics and how to identify movements caused by institutions.

To answer this question in order, because you have several intrinsic aspects to it, I will define each one of these aspects separately and thus avoid confusion:
What is institutional trading?
Institutional trading is governed by the interpretation of the trace produced by an interbank algorithm, which executes multiple orders loaded with liquidity causing manipulated movements in the market, inducing retail traders or investment funds of lower volume to lose their capital.
It is present in any financial asset such as:
- Stocks: (Facebook, Apple)
- Commodities: (gold, silver, oil)
- Cryptocurrencies (bitcoin, Ethereum, Litecoin)
- Stock Indices (Down Jones, Nasdaq, S&P500)
- Forex Currencies (Dollar, Euro, Swiss Franc)
Main characteristics of the institutions.
Known as: "The institutions, whales or the composite man." This is part of the characteristic terms with which these large mutual fund traders may be associated. They operate in a strategic and synchronized manner, shaping the market at will thanks to their purchasing power. Inducing beneficial movements for your trading. Where they will use in a simple and efficient way, the basic laws of commerce "buy low and sell high"... In short, "strong hands" are agencies dedicated to the manipulation of a financial asset at their whim. Allocating large amounts of money in small fragments of time taking into account the supply and demand available to not create an action against them at the time of closing a transaction.
Capture of Tradingview
It is known that they are characterized by 2 tools when setting their orders in the market.
- A very high capital to operate.
- Insider information that can influence the movements of an asset.
The positioned direction of a financial asset, can determine the intention and possible path that the price may make in the future. Based on:
- Towards where the highest point of liquidity is.
- Cumulative periods (purchases).
- Distributive periods (sales).
The market is designed for the intentional loss of the funds of natural persons so that these institutions can nourish themselves through premeditated entries taking advantage of their powerful influence. Natural survival forces the weaker to be the food of the stronger. That is why many traders do not reconcile effectiveness when trading, becoming food protein for the exchanges. Why does this happen? Why does retail see the need to close its position? Simple... They play on community fear causing panic among the retail public and forcing the trader to close entries to prevent significant losses.
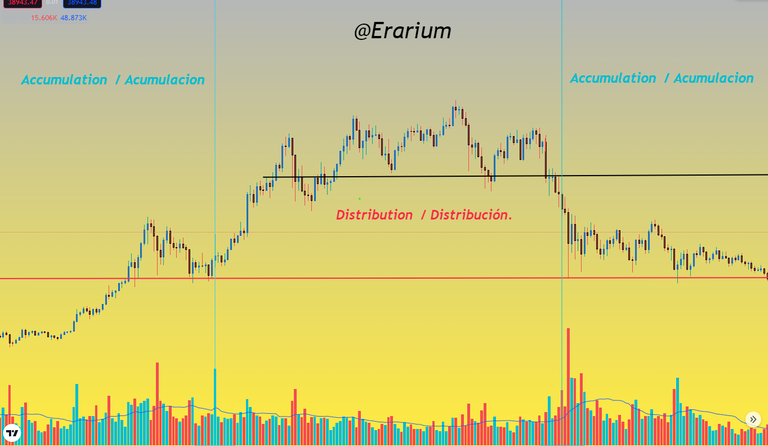
Cumulative periods by institutions.
Lots of volume and few drops on asset floors, in most cases occurring at important supports. And falls below support make a correction leaving a wick below the line on candlesticks near the area.
Strong demand appears near the end of the accumulation process, i.e. the accumulation occurs on the floors of the chart. Low volume purchases and small ranges are made, so as not to leave any trace of mitigation after a period of distribution. This accumulation is confirmed after the appearance of large green candles after purchases without much volume "Demand consumes supply". Raising the prices of the asset in an explosive way.
Distributive periods by institutions.
Higher sales volume and few displacements in the high zones of the chart, may occur at historical highs or resistances near the zone.
Large sell orders significantly exceeding the purchase, as a result it is interpreted that the supply increased enough to exceed the demand and we are in the presence of a distributive period by the institutions.
Taking into account the above points we can deduce the possible movements of an asset, in which direction the most liquid part is bidding and what action we should take to close an entry in positive.
Capture of Tradingview
Institutions and their relationship with Order Blocks..
What is an Order Blocks?
An Order Blocks is a set of buy and sell orders executed partially in established zones in the market. In other words, it is a huge set of orders configured to perform a certain action when the price quotes reach the minimum or maximum point set by the institution, causing repercussions in the trajectory of the price chart of an asset. An Order Blocks in most cases, is the main character when the price enters consolidation zones.
Order Blocks Bullish.
A bearish candlestick is formed, before the candlestick breaks the range or consolidation zone creating a new high.
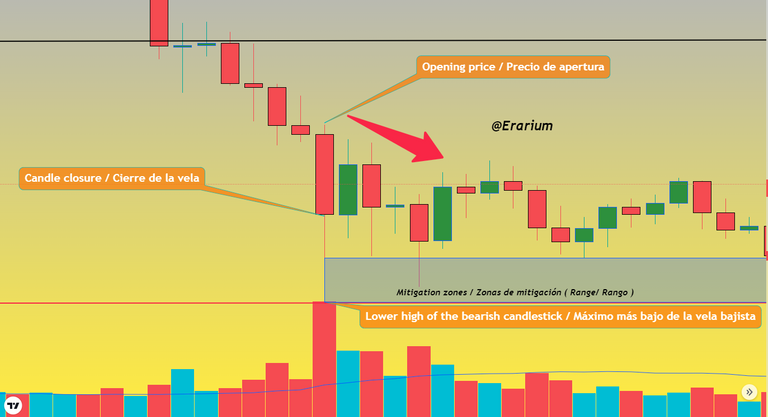
Bearish Order Blocks.
A bullish candlestick forms before the candlestick breaks downward, producing a new lower high and turning the consolidation line into strong resistance.
Order blocks conclusion:
An Order Block is executed after an uptrend or downtrend, producing range or consolidation zones where the price breaks the zone with breakot as a result of a reversal or a continuation of the trend. It is a stage that reveals a stacking of liquidity and great interest on the part of institutions splitting their operations so as not to unbalance the market. These are zones of supply and demand that can be exploited or merged with a strategy according to the trader's personal operations in order to obtain profits in this type of movements, whether bullish or bearish.
Operationally implemented institutional trading structure and order blocks.
Capture of Tradingview
The screenshot attached above is interpreted as follows:
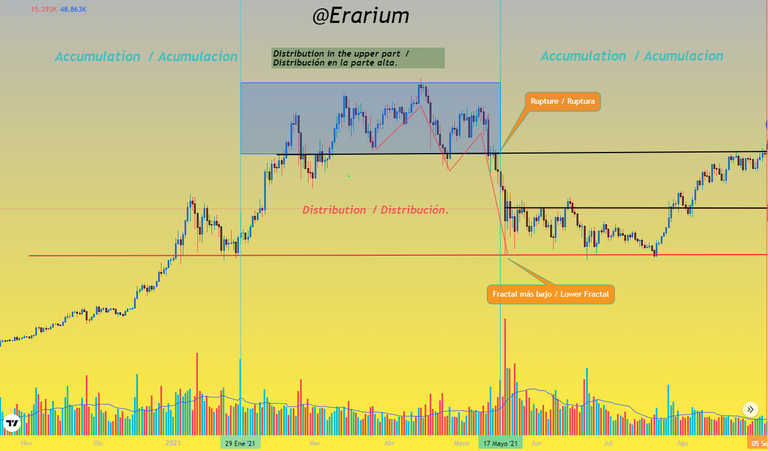
In the BTC/USDT market on 1-day timeframes, it is understood that the price made a distribution in the highest zone reached at that time waving between $64k and $66K. The blue box in the upper left hand zone encapsulates the range zone produced at that time. As I mentioned earlier before a bearish Order Block appeared a large green candle with low volume inciting chaos and desperate selling, then broke out of the range zone. The price entered a small downtrend confirmed with the trend channel. After settling at quotes between $ 38k and $ 33K remaining in consolidation or accumulation zones. If we look at the buying volume before entering accumulation zones, we can observe a clear selling force pushing the price to a fractal (lower high) on that run. Stopped at support (red line) leaving elongated wicks in each candlestick formation. The interpretation to these movements indicates that there is some interest in buying BTC below that line.... The price keeps bouncing back and forth exhausting the supply each time the price reaches levels below resistance. The market structure is composed of lower highs and lower lows resulting in a distribution zone because the strength of the market was on the demand side.
Capture of Tradingview
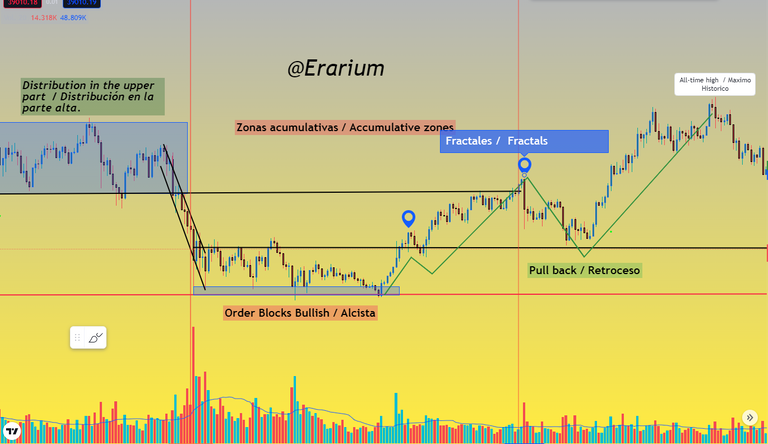
Once we pass the consolidation zone if we look at the price volume, every time the price drops below the line the candle is green, indicating small buying within the accumulation period. The other factor to take into account is the long wicks left on the price chart. It can be interpreted as a small inducement for the price to reach the zone where compounders are willing to trade. In the range zone volumes are small until the cumulative or distributive period ceases and a new momentum can begin. The market structure and as I mentioned earlier for this consolidation zone, the probability indicates that a new bullish cycle is about to develop after the appearance of the red candle with no volume, the sudden demand and the surprise break of resistance. The market structure indicates an uptrend after the formation of higher highs and higher lows to push the price to a new all-time high. In its path it leaves as a result 2 fractals (higher highs in the movement) one higher than the other confirming sufficient liquidity to maintain the asset's prices in a bullish period.
Conclusion
The risk of keeping track of these institutions decreases the likelihood of getting caught in market stages, as they "rule the market in a certain way". Institutional trading is an executable concept in any financial asset, timeframe and can even be implemented in multiple strategies. It is a teaching that guarantees knowing how to identify decisive periods to execute a possible entry.

Español
En la actualidad el "Trading" es una profesión popular ejercida por múltiples personas en búsqueda de libertad financiera, generar ingresos extras o destinarlo en ahorros para la jubilación. Es una negociación bursátil basada en la especulación de activos financieros con la finalidad de obtener un beneficio. Parte de los fundamentos del trading es el análisis técnico, análisis fundamental, gestión de riesgo y estrategias diseñadas personalmente para concretar una operativa. Existe una alta variedad de factores determinantes el cual puede acoplarse a nuestra forma de operar: Temporalidades, indicadores, patrones, etc. Lo que realmente importa es la base crucial sobre la dirección del mercado. El recorrido dirigido por la oferta y la demanda, zonas de liquidez y donde se sitúa el interés por parte de las instituciones o los minoristas.
De esta manera, se predice el desarrollo explicativo de esta publicación "El trading Institucional" abarca de manera directa el ideal principal que debe manejar un "trader" para comenzar a operar.
Conceptos básicos del Trading institucional y su función, características principales y como identificar movimientos ocasionados por las instituciones.
Para responder esta pregunta con orden, porque tienes varios aspectos intrínsecos en ella, definiré cada uno de estos aspectos por separado y de esta manera evitar la confusión:
¿Qué es el Trading institucional?
El trading institucional se rige por la interpretación del rastro producido por un algoritmo interbancario, el cual ejecuta múltiples órdenes cargadas de liquidez ocasionando movimientos manipulados en el mercado, induciendo a los operadores minoristas o fondos de inversión de menor volumen a perder su capital.
Se hace presente en cualquier activo financiero como por ejemplo:
- Acciones: (Facebook, Apple)
- Commodities: (oro, plata, petróleo)
- Criptomonedas (bitcoin, Ethereum, Litecoin)
- Índices Bursátiles (Down Jones, Nasdaq, S&P500)
- Forex Divisas (dólar, euro, Franco Suizo)
Características principales de las instituciones.
Conocidas como: "Las instituciones, ballenas o el hombre compuesto." Es parte de los términos característicos con los cuales pueden asociarse a estos operadores de grandes fondos de inversión. Realizan operativas de manera estratégica y sincronizada, moldeando el mercado a su antojo gracias a su poder adquisitivo. Induciendo movimientos beneficiosos para su operativa. Donde emplearan de manera sencilla y eficiente, las leyes básicas del comercio "comprar barato y vender caro"... En resumen, "Las manos fuertes" son agencias dedicadas a la manipulación de un activo financiero a su capricho. Destinando grandes cantidades de dinero en pequeños fragmentos de tiempo tomando en cuenta la oferta y la demanda disponible para no crear una acción en su contra a la hora de cerrar una operación.
Capture of Tradingview
Es conocido que estos se caracterizan por 2 herramientas a la hora de establecer sus órdenes en el mercado
- Un capital muy elevado para operar.
- Información privilegiada que puede influir en los movimientos de un activo.
La dirección situada de un activo financiero, puede determinar la intención y posible recorrido que el precio puede efectuar futuramente. Basándose en:
- Hacia donde está el mayor punto de liquidez.
- Periodos acumulativos (compras).
- Periodos distributivos (ventas).
El mercado está diseñado para la perdida intencionada de los fondos de personas naturales y así estas instituciones puedan nutrirse mediante entradas premeditadas aprovechando su poderosa influencia. La supervivencia natural obliga al más débil ser el alimento del más fuerte. Por eso múltiples traders no concilian una efectividad a la hora de operar convirtiéndose en proteína alimenticia para los exchange. ¿Por que sucede esto? ¿Por que el retail se ve en la necesidad de cerrar su posición? Sencillo... Juegan con el miedo comunitario causando pánico entre el público minorista y obligando al operador a cerrar entradas para prevenir perdidas significativa.
Periodos acumulativos por parte de las instituciones.
Mucho volumen y pocas caídas en los suelos del activo, en la mayoría de los casos se presenta en soportes importantes. Y las caídas por debajo del soporte realizan una corrección dejando una mecha por debajo de la línea en las velas cercanas a la zona.
Aparece una fuerte demanda en cercanías de finalizar el proceso acumulativo, es decir, la acumulación se produce en los suelos del gráfico. Efectuando compras de bajo volumen y rangos pequeños, para no dejar algún rastro de mitigación luego de un periodo de distribución. Esta acumulación es confirmada luego de la aparición de grandes velas verdes posterior a las compras sin mucho volumen "La demanda consume la oferta". Elevando las cotizaciones del activo de manera explosiva.
Periodos distributivos por parte de las instituciones.
Mayor volumen de ventas y pocos desplazamientos en las zonas altas del gráfico, pueden ocurrir en máximos históricos o resistencias cercanas a la zona.
Grandes órdenes de venta superando significativamente a la compra, como resultado se interpreta que la oferta aumento lo suficiente para superar a la demanda y estamos en presencia de un periodo distributivo por parte de las instituciones.
Tomando en cuenta los puntos anteriores podemos deducir los movimientos posibles de un activo, hacía que dirección puja la parte con mayor liquidez y que acción debemos realizar para cerrar una entrada en postivo
Capture of Tradingview
Las instituciones y su relación con los Order Blocks.
¿Que es un Order Blocks?
Un Order Blocks son un conjunto de órdenes de compra-venta ejecutadas de manera parcial en zonas establecidas en el mercado. Es decir, es un enorme paquete de órdenes configuradas para realizar una acción determinada cuando las cotizaciones del precio alcancen el mínimo o el máximo punto establecido por la institución, causando repercusiones en la trayectoria del gráfico de precios de un activo. Una Order Blocks en la mayoría de los casos, es el personaje principal cuando el precio entra en zonas de consolidación.
Order Blocks Alcista.
Se forma una vela bajista, antes que la vela rompa la zona de rango o consolidación creando un nuevo alto.
Order Blocks Bajistas.
Se forma una vela alcista antes de la vela rompa de manera descendente, produciendo un nuevo máximo más bajo y convirtiendo la línea de consolidación en una fuerte resistencia.
Conclusión de Order blocks:
Un Order Block es ejecutado después de una tendencia alcista o bajista, produciendo zonas de rango o consolidación donde el precio rompe la zona con breakot como resultado de una reversión o una continuación de la tendencia. Es una etapa que revela un apilamiento de liquidez y gran interés por parte de las instituciones fraccionando sus operaciones para no desequilibrar el mercado. Son zonas de oferta y demanda que pueden aprovecharse o fusionarse con una estrategia acorde a la operativa personal del trader para obtener beneficios en este tipo de movimientos ya sean alcista o bajistas
Operativa implementado la estructura de trading institucional y order blocks.
Capture of Tradingview
En la captura de pantalla anexada en la parte de arriba se interpreta de la siguiente manera:
En el mercado BTC/USDT en temporalidades de 1 día, se entiende que el precio realizo una distribución en la zona más alta alcanzada en ese momento ondeando entre $ 64k y $ 66K. El recuadro azul situado en la zona superior a mano izquierda encapsula la zona de rango producida en ese momento. Como lo mencione anteriormente antes de presentarse un Order Block bajistas aparece una gran vela verde con poco volumen incitando el caos y la venta desesperada, para luego romper la zona de rango. El precio entró en una pequeña tendencia bajista confirmada con el canal de tendencia. Luego de posarse en cotizaciones entre $ 38k y $ 33K permaneciendo en zonas de consolidación o acumulación. Si observamos el volumen de compras antes de entrar en zonas de acumulación, podemos observar una clara fuerza vendedora empujando el precio a un fractal (máximo más bajo) en ese recorrido. Detenido en el soporte (Línea roja) dejando mechas alargadas en cada formación de las velas japonesa. La interpretación a estos movimientos indica que existe cierto interés en comprar BTC por debajo de dicha línea... El precio se mantiene rebotando de un lado a otro agotando la oferta cada vez que el precio alcance niveles inferiores a la resistencia. La estructura del mercado está compuesta por máximos más bajos y mínimos más bajos dejando como resultado una zona de distribución gracias a que la fuerza del mercado estaba en la demanda.
Capture of Tradingview
Una vez pasamos la zona de consolidación si observamos el volumen del precio, cada vez que el precio cae por debajo de la línea la vela es verde, indicando pequeñas compras dentro del periodo de acumulación. El otro factor a tomar en cuenta son las largas mechas dejadas en el gráfico de precio. Se puede interpretar como una pequeña inducción para que el precio alcance la zona en las que los hombres compuestos están dispuestos a negociar. En la zona de rango los volúmenes son pequeños hasta que el periodo acumulativo o distributivo cese y pueda dar comienzo a un nuevo impulso. La estructura de mercado y como lo mencione anteriormente para esta zona de consolidación, la probabilidad indica que está por desarrollarse un nuevo ciclo alcista luego de la aparición de la vela roja sin volumen, la demanda repentina y el rompimiento sorpresivo de la resistencia. La estructura del mercado indica tendencia alcista luego de la formación de máximos más altos y mínimos más altos para así impulsar el precio a un nuevo máximo histórico. En su recorrido deja como resultado 2 fractales( máximos más altos en el movimiento) uno mayor que otro confirmando la suficiente liquidez para mantener en periodo alcista las cotizaciones del activo.
Conclusión
El riesgo de seguir el rastro de estas instituciones disminuye la probabilidad de quedar atrapado en etapas del mercado, ya que estos "rigen el mercado de cierta forma". El trading institucional es un concepto ejecutable en cualquier activo financiero, temporalidad e incluso puede ser implementado en múltiples estrategias. Es una enseñanza que garantiza el saber identificar periodos determinantes para ejecutar una posible entrada.


Interesante post!!
Muchas gracias, mi objetivo es que puedan también ver la profesión del trading de la forma más sencilla posible. Saludos.
Muchas gracias, me alegra que te haya gustado, espero te sirva para comprender el mercado.
Congratulations @erarium! You have completed the following achievement on the Hive blockchain and have been rewarded with new badge(s):
Your next target is to reach 25000 upvotes.
You can view your badges on your board and compare yourself to others in the Ranking
If you no longer want to receive notifications, reply to this comment with the word
STOPCheck out the last post from @hivebuzz:
Support the HiveBuzz project. Vote for our proposal!