We need to maintain that level otherwise... | BTC Price Analysis 29-12-2021 |
Hello everybody, as we know bitcoin is showing some weakness at the moment trading down near 48000. A lot of people are wondering if this is the market cycle coming to an end, what may happen from here, and if the market does drop down further where might it go to. I think a lot of people were caught off guard when we were sitting at right around 57000$ and the price of bitcoin rapidly dropped within a two day time period on December third and December fourth that you can see the price rapidly dropped from around 57000$ down to a closing price at 49000$.
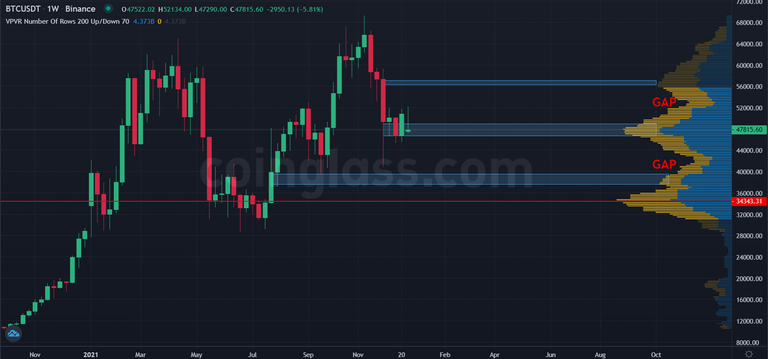
If we look at the volume profile visible range on the weekly chart you see us drop from 57000$ through into the gap at around 53000. Once we get into this relative gap we fall down rapidly to the next peak at around 49000. What that means is we fall into this relatively low volume range and when there is a relatively low volume range what will happen you will fall down until you reach your next peak which is a resistance level so we fall from this level at 57000$ into this gap and then we rapidly fell down to another peak.
In a bearish scenario, where is the next level we may expect to fall to if we drop below from this high volume region? Well if we get down to 46000$ and lose that level then we're probably going to drop down to our next high volume node level which will start right at around 40000$ and it doesn't truly become an area of high volume really until you get back down to around 39000$ and then we have a lot of volume built up in this range.
Another thing you can note is the 50-week moving average is sitting at around 47000. If we drop below 50 MA, well we have shown that in the past that when we drop below this 50 MA and start getting weekly closes below it we drop down to this 200-week moving average which is right now around 19000$. We have done it numerous times in the past. Typically in the past when we have dropped below the 50 MA we don't head down to the 200 MA right away. It usually takes some time, in fact, a significant number of weeks. The only time in fact where we have dropped below and quickly got down to the 200 MA was back when covid happened. Early March 2020 we dropped below this 50 MA and headed straight down to the 200 MA.
The bottom line is if you lose this 46000$ level we are likely going to see bitcoin rapidly head down to around 40000$ and then there is a ton of volume all the way down through 30000$ and from there if you lose that 30000$ level which we held back in July, there is a significantly low volume node below that level. This whole area has very low volume. What you typically see in these type of situations is the price rapidly falls down until it reaches its next significant support level so you may see some support at 27k then you are looking at 23k for instance. One of the potential bullish scenarios I hope we could see is a bounce off of the 50 MA or just price staying above 46000$. Then we should see a rise to our next resistance level at 57000.
Disclaimer: Not financial advice. Please be careful when trading this channel is just my opinion and perspective of what the charts look like in my opinion. This is to be used ALONGside your technical analysis and to give you things think about that you might have missed. You have to make your own decisions investing is risky. Don't invest what you can't afford to lose.
Hope you found today’s article helpful. If you want to learn more about trading follow me at @fizzonmyjayyce. Have a nice day :)
Posted Using LeoFinance Beta