Analisis del Bitcoin || Bitcoin Analysis.
Que tal amigos traders, espero y mis post sean de gran ayudar y por supuesto de su agrado, gracias por el apoyo.
En esta ocasión les traigo un pequeño analisis al Bitcoin, la cuál a sufrido duros golpes desde hace semanas, cosa que sabiamos que algun momento pasaria. Eso no es de preocupación más bién es de estar analizando hasta donde será y colocar nuestra compra.
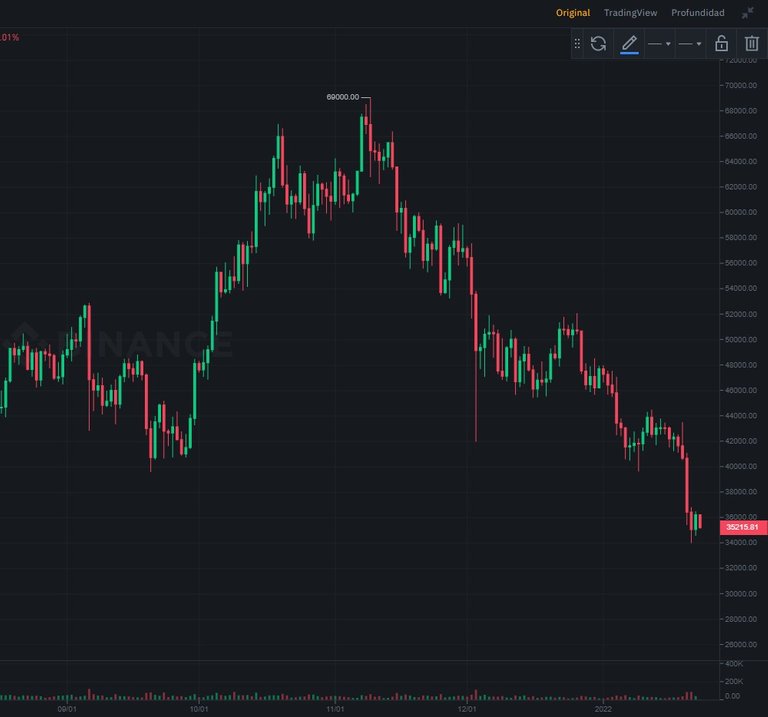
Captura de mi broker
En la figuara se muestra la caida del bitcoin en los ultimos días, podemos observar su pico mas alto el cuál fué 69000btc desde entonces ha estado en caida libre hasta el momento estando en una tendencia bajista que en cualquier momento llegará a su fín.
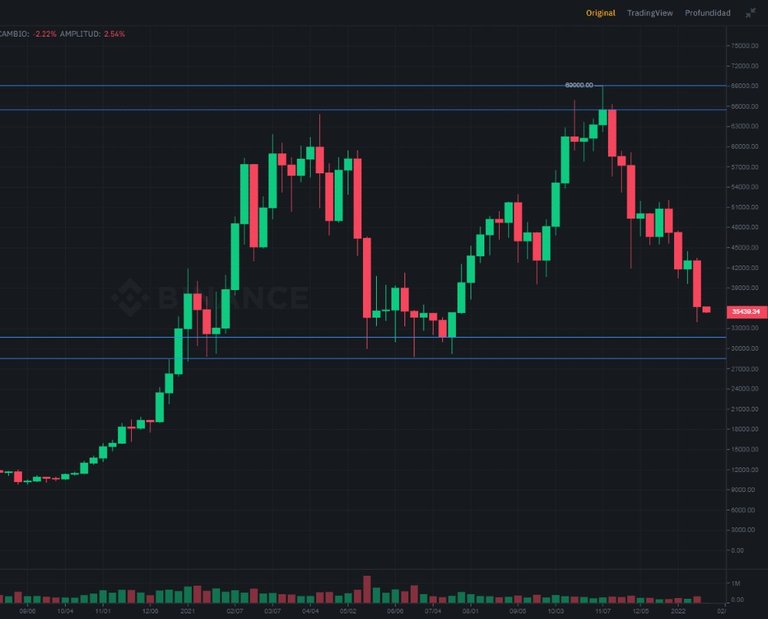
Captura de mi broker
Como se puede apreciar en la imagen, en éste caso el período es por semana podemos apreciar que la gráfica nos muestra dos pico máximo. El cuál el segundo pico máximo solo paso por muy poco el primer pico máximo formando una resistencia de gran fuerza rechazando el precio.
Se puede ver que precio se acerca al soporte o neckline el cuál ya fue tocado una vez y fue rechazo.
Mi analisis según el gráfico para esta semana es una vela roja la cuál tocará el soporte o neckline buscando romper ese mínimo. Estimo que el precio llegará hasta los 31000Btc.
Bueno aqui les dejo un pequeño análisis del comportamiento del bitcoin en gráfia por periodo en hora y analizando la gráfica en período de semana. Espero que sea de gran contribución.
Nota: Con esto no estoy dando consejos de inversión ya que cada quien es responsable de invertir su dinero, simplemente comparto de mis conocimientos sobre lo que es el trading, ya que existen diferentes aspectos que se deben aprender para comenzar a operar en los diferentes mercados.
Cualquier pregunta, critica o sugerencia estoy abierto para ellos, me pueden dejar en los comentarios sobre que otro temas acerca del trading les gustaria compartir.
Sin mas nada que decir me despido, saludos mi amigos!!
English
Hello traders friends, I hope my posts are of great help and of course to your liking, thanks for your support.
This time I bring you a small analysis of the Bitcoin, which has suffered hard blows for weeks, which we knew that some time would pass. That is not of concern rather is to be analyzing how far it will be and place our purchase.
Capture of my broker
In the figure shows the fall of bitcoin in recent days, we can see its highest peak which was 69000btc since then has been in free fall so far being in a downtrend that at any time will come to an end.
Capture from my broker
As can be seen in the image, in this case the period is per week we can appreciate that the graph shows us two maximum peak. Which the second maximum peak only narrowly passed the first maximum peak forming a resistance of great strength rejecting the price.
You can see that price is approaching the support or neckline which has already been touched once and was rejected.
My analysis according to the chart for this week is a red candle which will touch the support or neckline looking to break that low. I estimate that the price will reach 31000Btc.
Well here I leave a small analysis of the behavior of bitcoin in graph by period in hour and analyzing the graph in week period. I hope it will be of great contribution.
Note: With this I am not giving investment advice as everyone is responsible for investing their money, I simply share my knowledge about what is trading, as there are different aspects that must be learned to start trading in different markets.
Any questions, criticisms or suggestions I am open to them, you can leave me in the comments on what other topics about trading you would like to share.
With nothing more to say I say good bye, greetings my friends!!!
Posted Using LeoFinance Beta
Thank you for including an English translation in your article. It sounds like you have a good investment plan.
I hope you are wrong and BTC does not dip below 33K :-D