Bullish Signs for Bitcoin - Pi Cycle Top Indicator
The indicators are the tools that are referred to adress the sentiment of the market in a certain period of time. While most of the investors rely on the indicators to identify the volume, trend and the correlation between the other markets & commodities, the indicators are not the only sources that can be used for investment plans.
Among the most commonly used ones, Relative Strength Index (RSI), Moving Average Converge Diverge (MACD), Ichimoku and Bollinger Bands are the ones that are preffered by crypto investors. In terms of Bitcoin, there are some other indicators that can be a guide for Bitcoin investors (so do the altcoiners) while making a decision for their investment plans.

For those who do not know, Lookintobitcoin has useful tools for investors to check the indicators for free. What is good about these indicators is that they track the data from the very beginning of the trades in Bitcoin. You can check any data even from 2012 in multiple indicators. I'll talk about 2 indicators that I enjoy following.
Pi Cycle Top Indicator
The Pi Cycle Top Indicator has historically been effective in picking out the timing of market cycle highs to within 3 days.
It uses the 111 day moving average (111DMA) and a newly created multiple of the 350 day moving average, the 350DMA x 2.
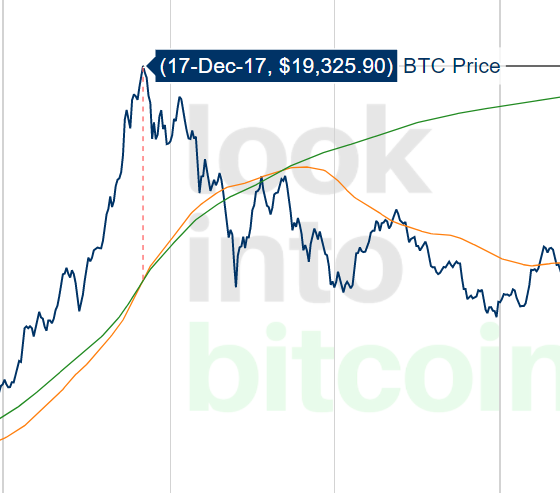
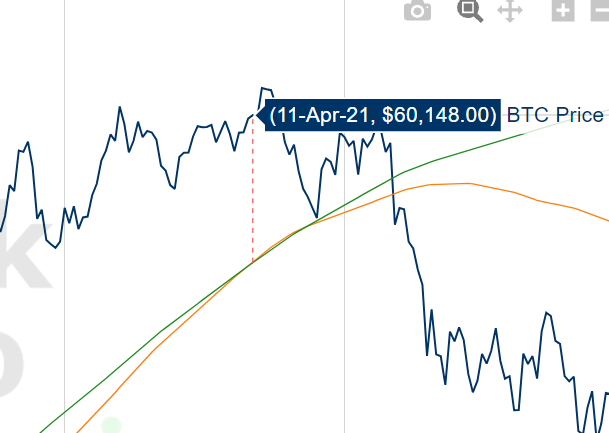
So, whenever we see the cross of 111DMA, the indicator highlights it with dashed lines.
In 2017, the indicator had a nice degree of accuracy to indicate that it can be better to sell Bitcoin or end up the long positions.
In the recent All time high case, the indicator spotted 3 days before the 63K levels. The indicator has 3 days of fallibility rate as it is stated in the overview. To be honest, I was too greedy to rely on the indicator at these days. Thus, I decided to bear the sharp decrease in the price of Bitcoin... After that day, I gave credits to Pi Cycle Top Indicator and being emotional costed an arm and a leg 😅
Today's price actions
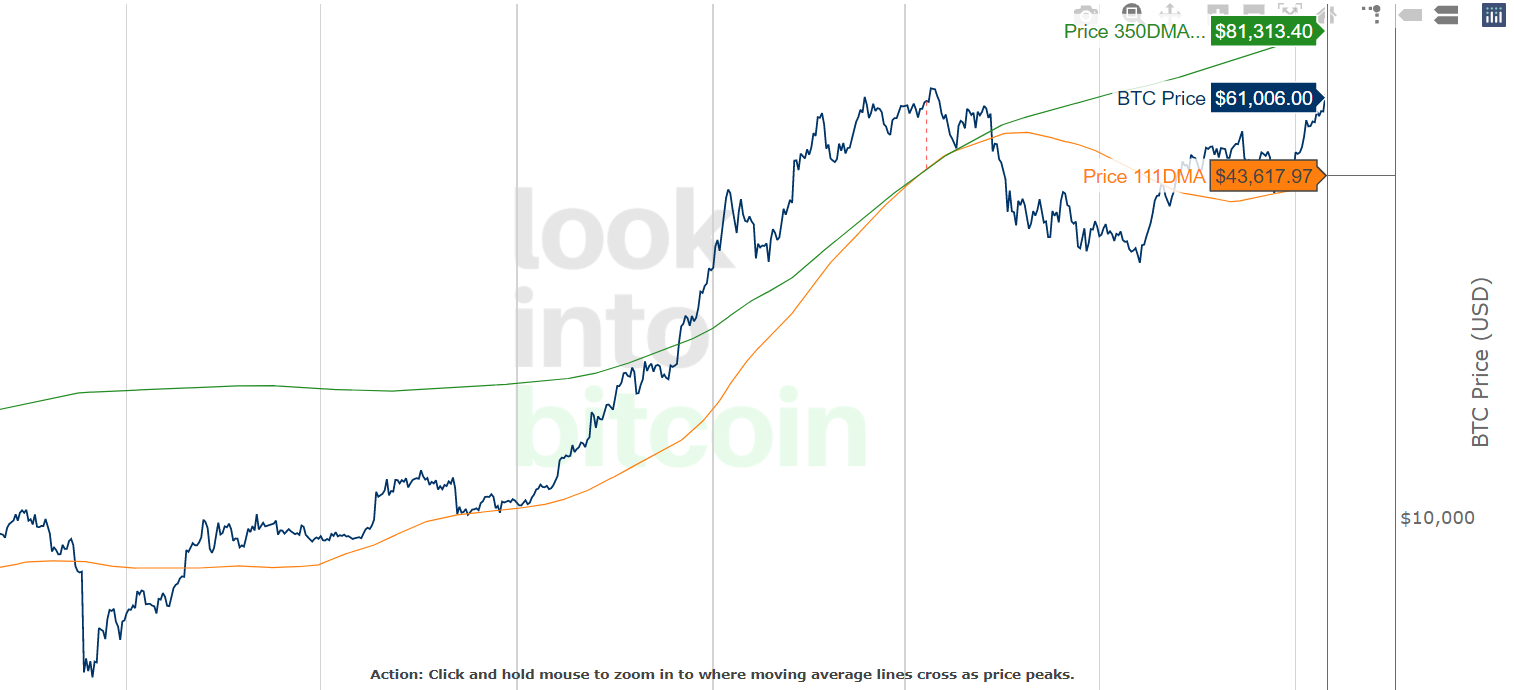
The 350DMA indicates $81K above levels while 111DMA works as a support line about $44K. Before the recent pump, the price tested the 111DMA support for to times and the dump is rejected. Any near level to $80K would be place that I would consider taking profit.
While the spread between the moving averages are too broad, I do not expect to see any other crossover soon. However, it would not be suprising to test $80K levels before 2022. The market looks still bullish for Bitcoin and the indicators also support the sentiment. For me, getting a confirmation from the indicators is more than enough for the purpose of the use.
TL;DR
Lookintobitcoin is a nice place where you can utilize several indicators and on-chain data to have an idea about the sentiment of the market. IMHO, the indicators are not enough sources to rely on for investment decisions. However, I give credits to some of the indicators like Pi Cycle Top and HeatMap on LookintoBitcoin considering my previous experience. In terms of the current market conditions, the moving averages sign an uptrend that may last until $80K+ for Bitcoin. If you feel like confirming your market analysis via indicators, there are many options waiting for you.
Posted Using LeoFinance Beta


https://twitter.com/idiosyncratic1_/status/1449830739449630723
The rewards earned on this comment will go directly to the person sharing the post on Twitter as long as they are registered with @poshtoken. Sign up at https://hiveposh.com.