Prediction Model For Leo Token Considering Hive And Avax Price (June 4 to September 22, 2022)
The bear market has resulted into the need for crypto investors not to loose hope by carrying out some statistical based test of certain assets.
I will be analyzing the price of avax and hive for predicting Leo Price.
Below are the content of the prediction model for leo price using price of hive and avax.
-Data collection
-Data analysis and Interpretation
-Conclusion
-Other Images
Data collection
The price of leo, hive and Avax was collected manually via coingecko and coinmarket cap into SPSS application.
Data analysis
The method used in this analysis is prediction.
Analysis of data resulted into considering the following sub menus.
Entry Variable
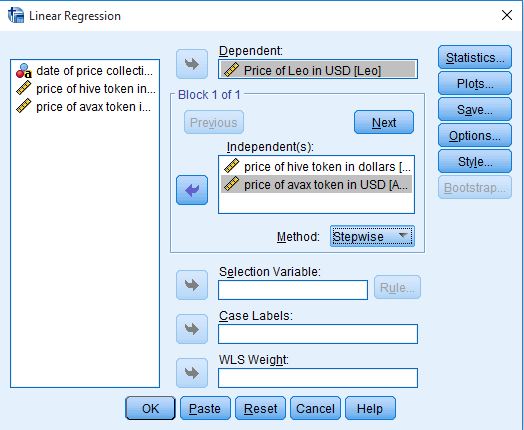
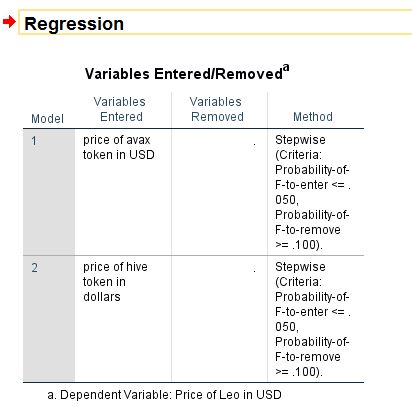
From the image below the variables to be entered to determine the price of leo token are the price of hive and avax.
Model Summary
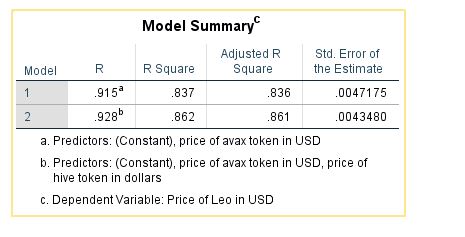
The image below present which of the model best suits our concern. You can see the Adjusted R square of model 2 is higher than that of model 1. It best to go for model 2.
Significance of the model
The model explains more of variance in the leo data provided. The one with higher explanatory power which is 86% of variance in leo data. We can trust our model upto 86%.
Correlation
It is important to understand the following basics before proceeding to interpret the relationship type amongst the asset.
A positive relationship indicates that as the price of one asset increases the price of the other increases as well and vice versa.
A negative relationship indicates as the price of one asset increases the other will decrease and vice versa.
The relationship can either be strong or weak depending on how it’s close to the axis.
When it’s close to +1 or -1 axis the relationship said to be strong. When it is close to zero the relationship is said to be weak.
Result of Analysis
The result of analysis is seen below.
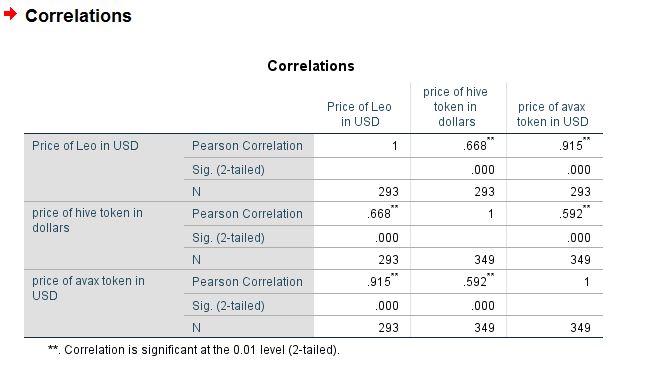
The coefficient of correlation between leo and hive is 0.668. It is positive and strong.
Thus it best predicts the model correctly.
The coefficient of correlation between leo and avax is 0.915 which shows a perfect correlation and hence it very useful in explaining the result.
Model price for leo
The model that best explains the analysis is model 2. The coefficients are as seen below.
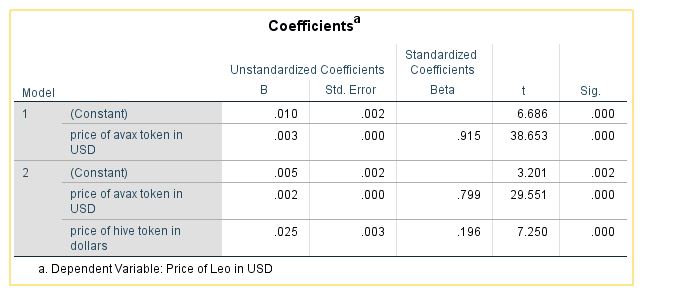
Price of Leo = 0.005 + 0.002 * price of avax + 0.025* Price of hive
I will like to test with data provided on the 23rd of September, 2022.
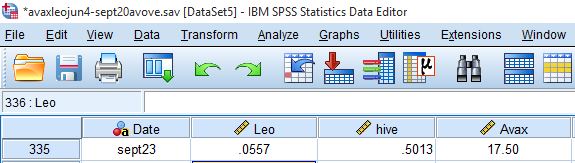
The price of avax was $17.50
The price of hive was $ 0.5013
Inserting it into the equation we have
Price of Leo = 0.005 + 0.002 * price of avax + 0.025* Price of hive
Price of Leo = 0.005 + 0.002 * 17.50 + 0.025* 0.5013
Price of Leo = 0.005 + 0.035 + 0.0125
Price of Leo = $0.0529
In contrast to the entered variable for leo price which was $0.0557 there seem to be a difference of $0.0027 between the actual and predicted value as the Adjusted R square explains (86% of variance in leo price).
Conclusion
This article has presented a brief summary of prediction among the Avalanche and hive blockchain with reference to leofinance.
Other images includes
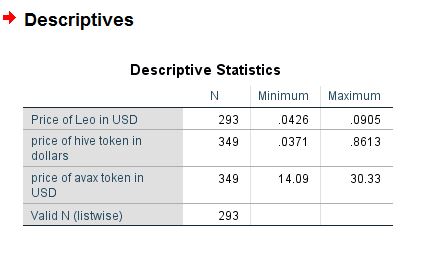
Maximum and minimum values of asset
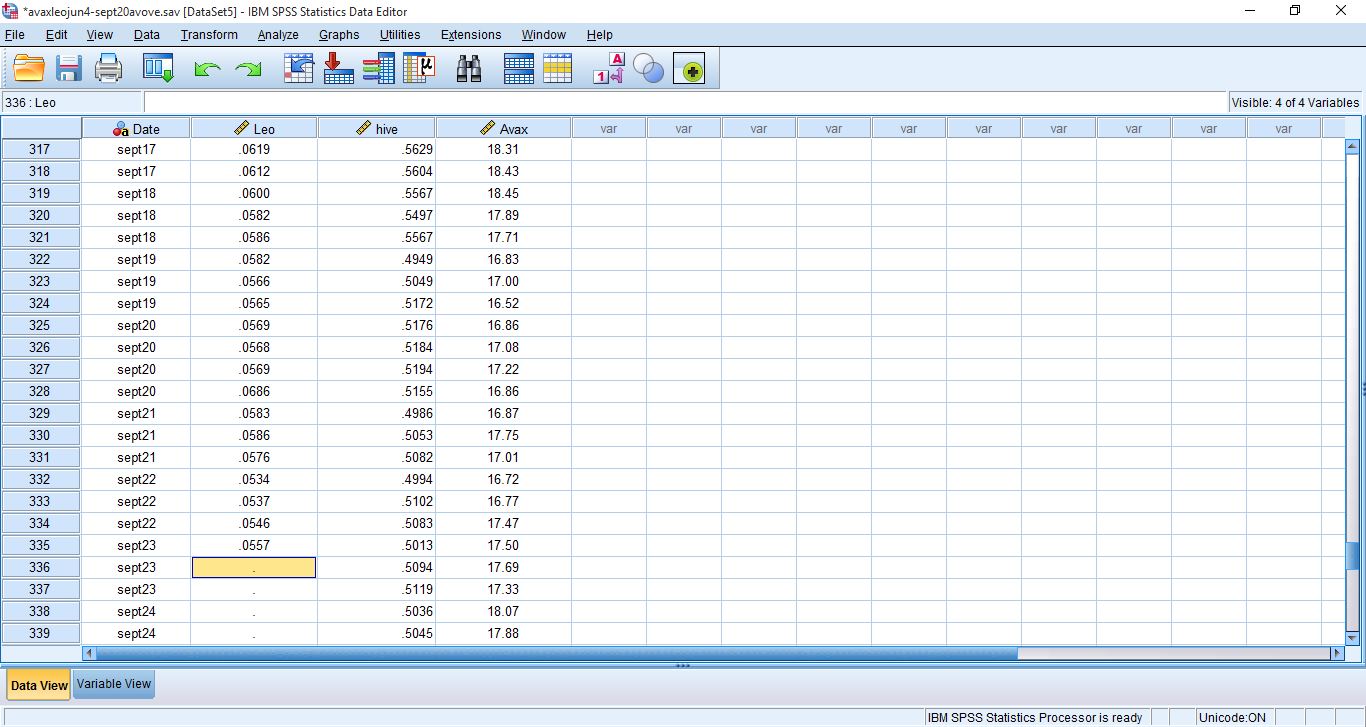
Data view
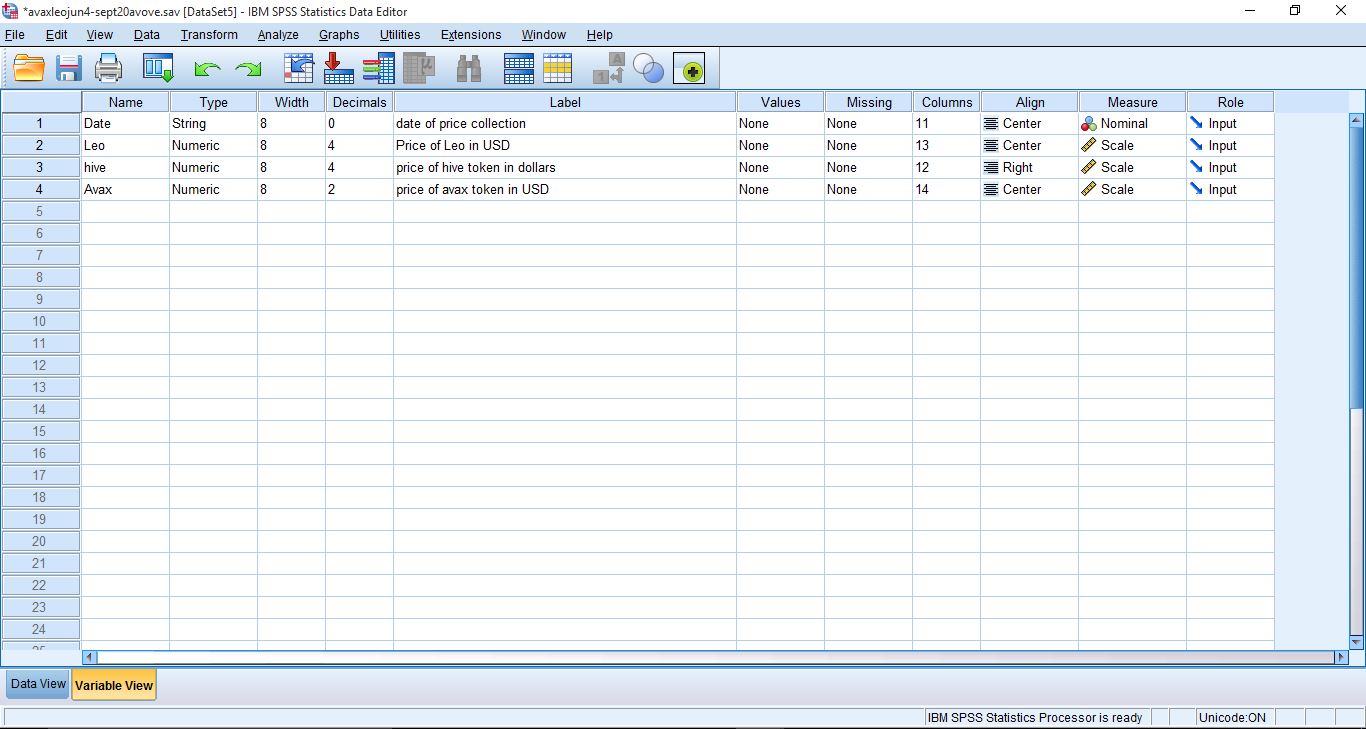
Variable view
Thanks for reading, I call on @forexbrokr to please evaluate the content format for further improvement.