The Future Of FTX Through Price Analysis
One of the greatest concerns of FTX investors is if there is a tendency to make it up the track again. FTX is a digital asset owned by Sam Bankman fried, recently did he file case for bankruptcy of the sudden crash of his system.
This article will analyze the price of FTX using SPSS and what will the future of FTX looks like.
I would consider the following subtitles necessary in the study.
Line graph of FTX price
The line graph shows the price of FTX between the periods of October 1- December 2, 2022 is as seen below.
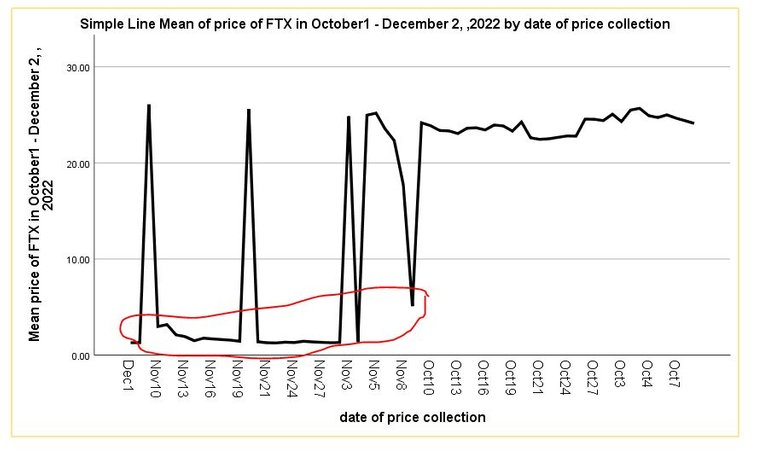
However this is not a good indication because the price might almost drip to cent which with time probably may return to a weird value after dopping from $84 ATH.
Looking at the chat, having divided it into two equal halves it is clear that the right part represents the performance in October after having an All-time high of about $84 a year ago, the price dropped low to above the $20 dollar range but considering the month of November, there was a drastic reduction in the price of FTX which shows with time may even reduce more than that.
It seems investors aren’t really happy of what has occurred and are seeking means to pump all of their resources from FTX trade.
More details of this will be seen in the barchart.
Barchart of FTX price
Below is an extended version of the line graph which shows detailed information in bars.
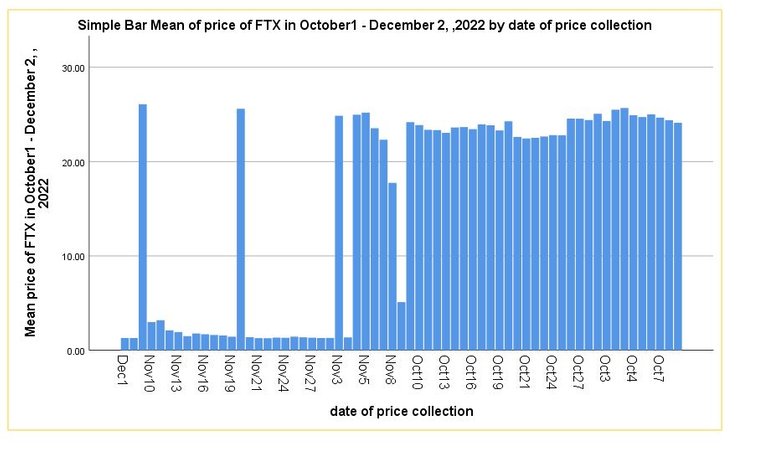
As explained earlier, there might be a future in FTX if it had not stoop below the normal. Within a short frame or interval of one month period, the price fell to a dollar and some cents. Having been like this may even warrant it ending up in cents fully as time proceeds.
Boxplot of FTX price
The boxplot below presents the price of FTX in two months period.
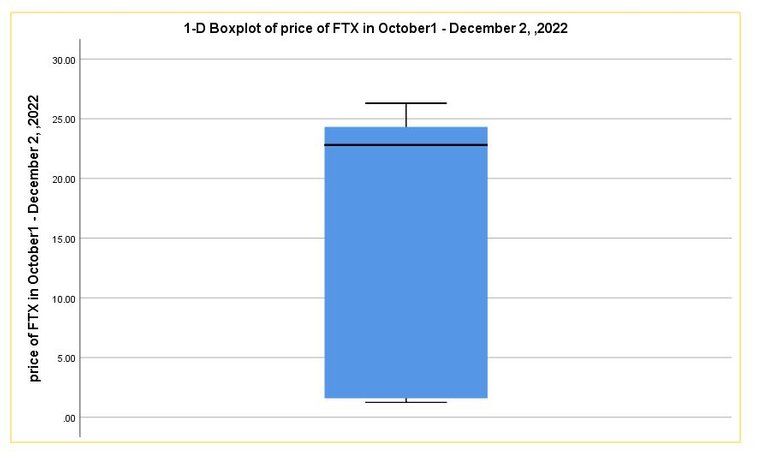
Having considered the two parts of the boxplot which are the upper and downwards whiskers, it is clear that it had more of lower prices in the downwards whiskers which deviates far away from the median or middle price.
Maximum and minimum price of FTX
The maximum and minimum price of FTX during a two month observation period are stated below in the table.
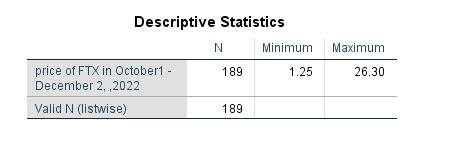
FTX had a maximum price of $26.30 and a minimum price of $1.25. However this is abnormal within a short period of time and indicates almost 95.2% fall from the unusual price. It simply implies in the nearest future it might dip futher to another 95% which may leave its price in cents.
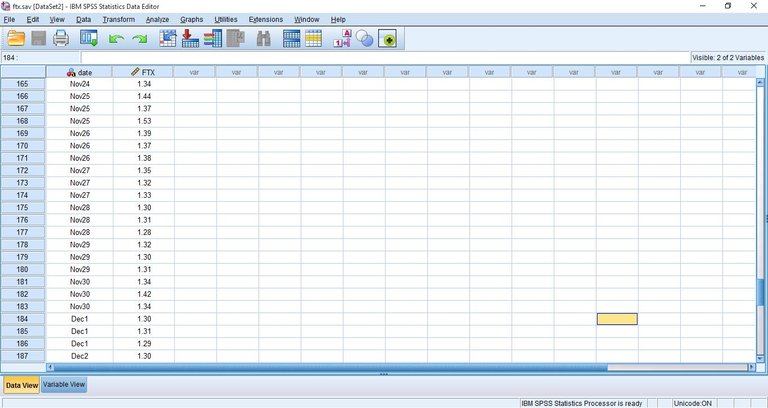
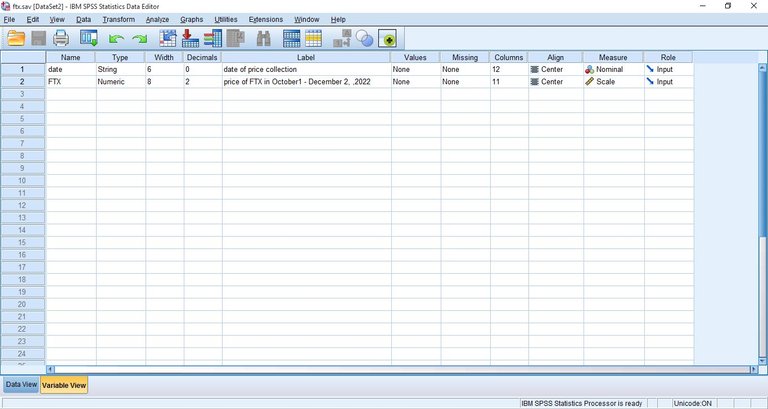
Other related images are the data and variable view.
The data view allows for price entry on three entries to avoid error whereas the variable view is the frame work for data view.
Data view
variable view
Conclusion
This article presented the performance and future of FTX asset. However, within an interval of one month, the price of FTX has experienced 95.2% decrease. Other relevant considerations are the line graph, bar chart and boxplot.
Thanks for reading, do have a happy week.
Posted Using LeoFinance Beta
https://twitter.com/1455313948425732098/status/1599243454671818753
The rewards earned on this comment will go directly to the people sharing the post on Twitter as long as they are registered with @poshtoken. Sign up at https://hiveposh.com.
For me FTX will see a lot of problems in the next future, i hope for a FTX movie on Netflix😁