BTC Market Outlook Using Technical Analysis
This chart looks complicated but is combination of both Short-term & Longterm patterns which are important milestones to shift from a bear to bull market.
Bull Market Support Band is shown in orange & green lines with shades in them. It is combination of 20 week MA & 21 week EMA. It is defination for bear or bull market for me. People may have different or complex definition. But I define Bull Market if we are above the band and bear market when we are below the band. Band also act as support and resistance in logterm market shifts. For example after July bottom, we moved up and tested the band till October as support before moving up a rally to put a ATH. During mega bull markets we can stay above band for weeks without testing it like happened in 2020 or we can stay above band but keep on testing it as support after few weeks as happened in 2016-17 bull run. For now Bull Market Support Band is ranging from 47500 to 51200. These are important milestones to shift momentum from bears to bull.
Daily RSI can be a good indicator to track market moves strength. For example a big upside move with low RSI is week. Similarly a big downside move with higher RSI is week.
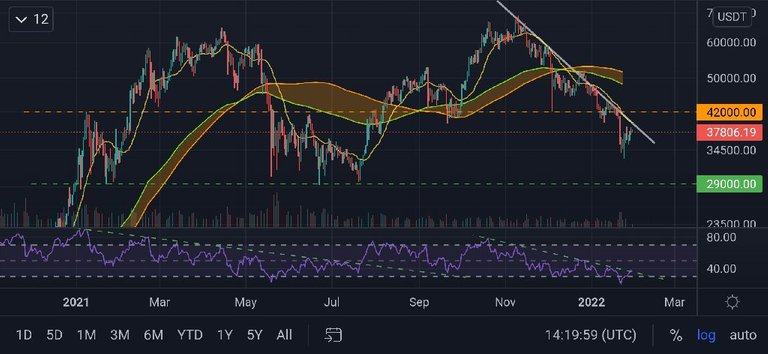
After May crash, RSI was one of the simplest indicator to confirm a breakout as it broke resistance from a downward trend line. We are in similar situation and RSI is little above trend line, but i would not call this a breakout because we need enough margin else it can be a fakeout or just a small error in drawing a trendline which i can shift to upwards by a small amount and RSI will get below it.
We have already bottomed out based on RSI levels but there is magin of a small flash crash of 25% to accommodate 1 more RSI bottom. This is similar to what happened in start of COVID and this time FED USA can cause this because of inflation. From last week it seems that FED is still not increasing interest rates and has hopes to control inflation without it as supply chain in world is going live. Another thing would be US stock market which closed RED in last week but was able to pull up a up rally in last fee hrs. On Monday if Stock Market opens in green and stable, we may see a similar affect on crypto.
What we need is 2-3 more daily green candles which will sustain the RSI to the levels and also a move above 20D MA (39750). It is continuously coming down by 200 points daily, all we need to do is sustain our daily green candles till we hit a resistance.
Volume on other hand is decreasing for last 4 days which is indication of buyers are not buying and waiting for either a price crash or break the resistance of 40k. We need a whale to push us up the levels else retail is still bearish & retail is always wrong.
Two important levels on chart are 29k & 42k which are both psychological levels as well as strong resistance or supports. We want a more sideways action above 40k levels till we get all the momentum to go up the bull market support band.
Can we continue this uptrend for FEB month? January is going to close tomorrow so this can be a volatile day to decide market closes. Let's hope we either get a green candle today or a red candle with negligible body as we can't afford big red candles.
Posted using LeoFinance Mobile