BTC/USD market analysis for 8th april,2021
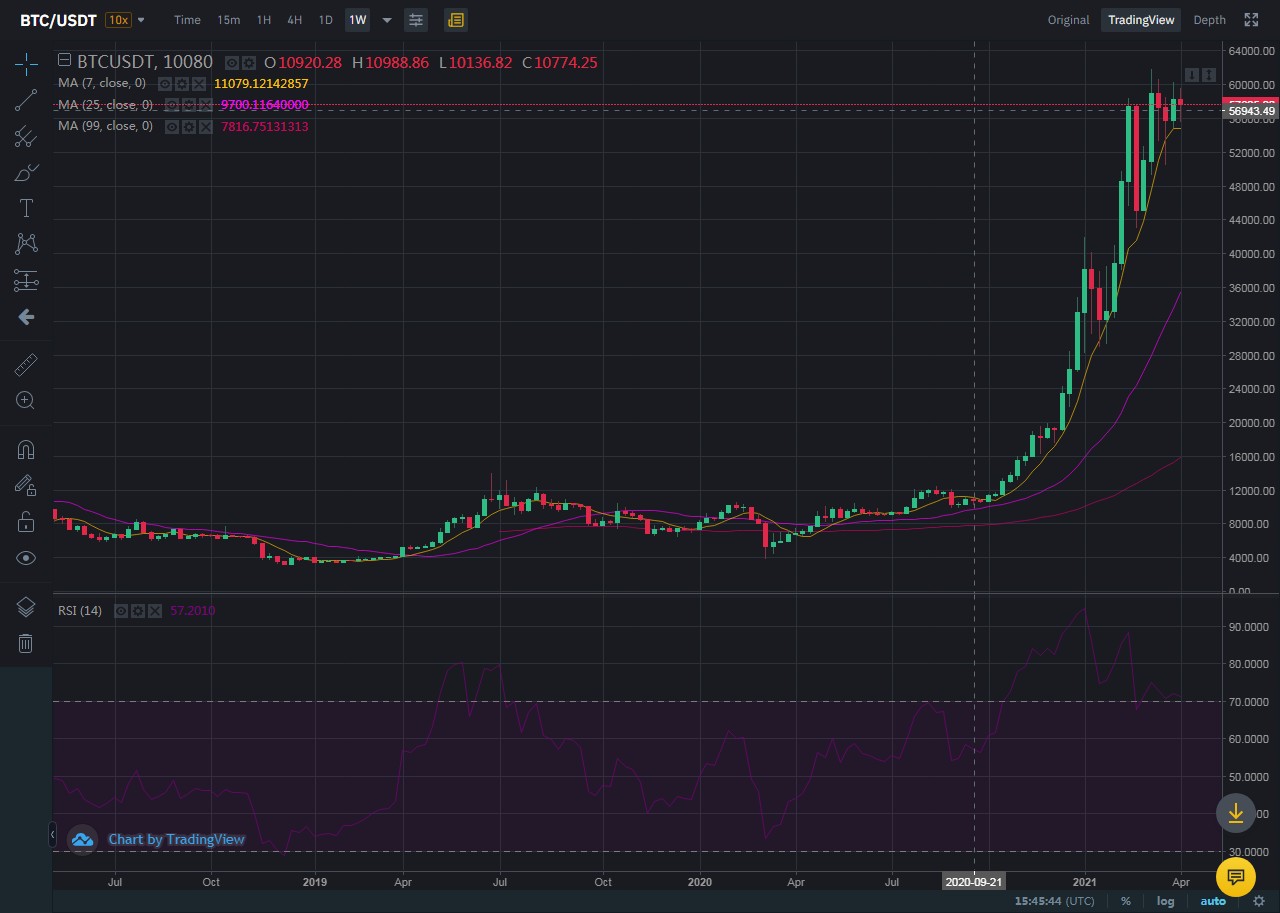
On the weekly chart of the bitcoin market it is showing a bearish signal but cannot be confirmed yet until the bitcoin price breaks the support level which is at $54863 and the current price is $57,637 when this post was created....
A break below the support level will send the price down to $48000 or below.....
But on the daily chart,it is showing a good buy signals and a bullish run is beginning to show up,if the price of the bitcoin can stay above the current resistance level which is at $58,847 then it means that the bullish run is confirmed and we should expect the bitcoin price to reach $61900 which is the next resistance level,and any break above the price will shoot bitcoin up to $70000.....
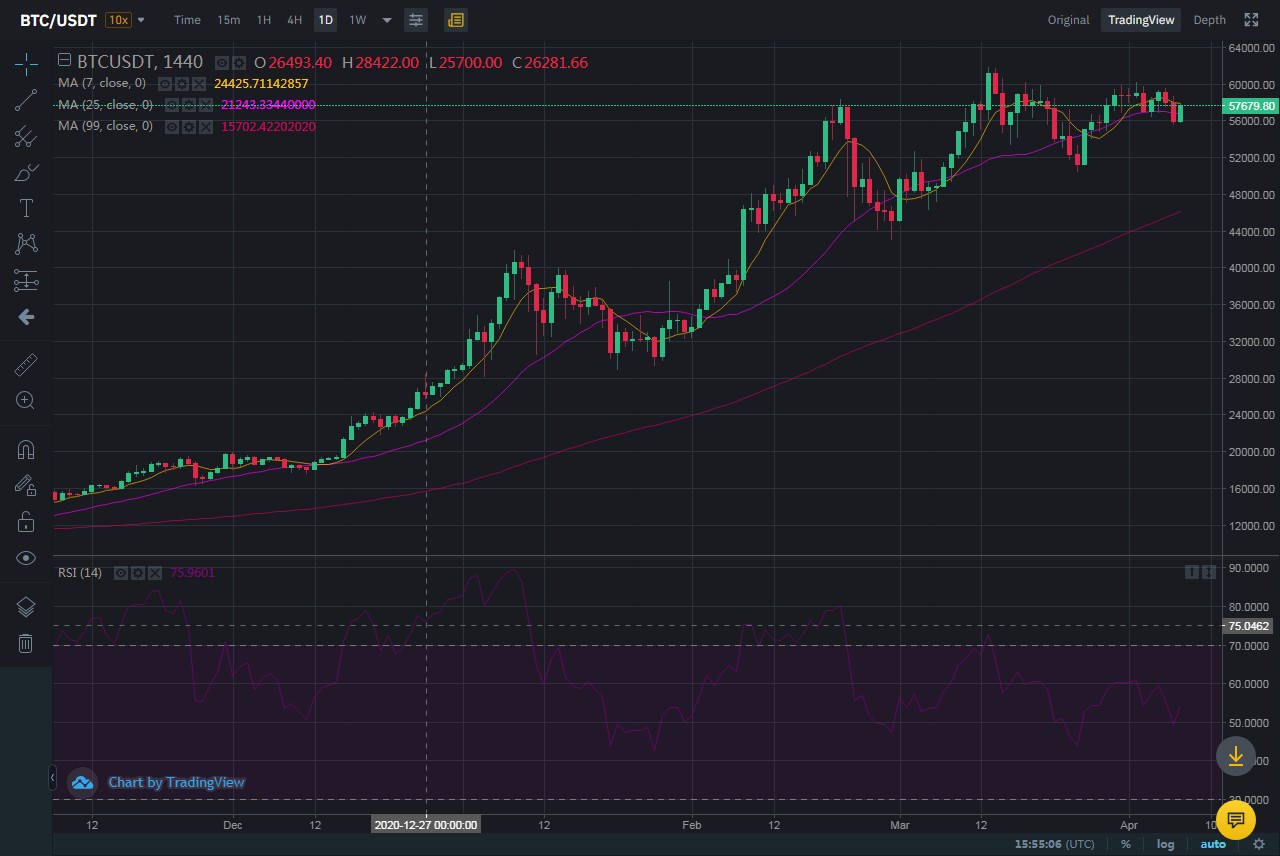
The bitcoin appears bullish on the daily chart which means for now we should expect to see continuous price increase until the demand and supply brings the price to the support levels or resistance levels depending on the decision of traders on the market.....
Posted Using LeoFinance Beta
Congratulations @lamboreviews! You have completed the following achievement on the Hive blockchain and have been rewarded with new badge(s) :
Your next target is to reach 20 posts.
You can view your badges on your board and compare yourself to others in the Ranking
If you no longer want to receive notifications, reply to this comment with the word
STOPCheck out the last post from @hivebuzz:
Support the HiveBuzz project. Vote for our proposal!