Basic and simple trading strategy that everyone can apply. [EN-ES]

Cover created in Canva
Continuing with the financial content, this time I will bring a trading strategy that basically anyone initiated in the investment world can learn and apply in the markets. The strategy adapts to any seasonality and financial asset of our choice, the only thing is that we must be aware of all the rules and regulations of the strategy to get the best out of it.
I hope you like it, these are some types of sections that I plan to upload to my Blog, looking for the continuous learning of the entire cryptographic community that is dedicated or is starting in cryptocurrencies. Always before starting I must emphasize that in no way what is exposed in my profile are investment recommendations, my intention is only to educate users who see my content.
Now then, with nothing more to say, join me:
Continuando con el contenido financiero, en esta oportunidad traeré una estrategia de trading que básicamente cualquier iniciado en el mundo de las inversiones puede aprender y aplicar en los mercados. La estrategia se adapta en cualquier temporalidad y activo financiero de nuestra elección, lo unico es que debemos estar atentos a todas las reglas y normas de la estrategia para poder sacarle el mejor provecho.
Espero que sea de su agrado, estos son algunos tipos de secciones que pienso subir a mi Blog, buscando el aprendizaje continuo de toda la comunidad criptográfica que se dedica o esta comenzando en las criptomonedas. Siempre antes de comenzar debo resaltar que de ninguna manera lo expuesto en mi perfil son recomendaciones de inversión, mi intención es solo educar a los usuarios que vean mi contenido.
Ahora bien, sin más nada que decir, acompáñenme:

EMA + Trend Line Break Strategy | Estrategia de la EMA + Ruptura de la línea de Tendencia

The EMA + Breakout strategy is about the "Price Action" in conjunction with the technical indicator called "Exponential Moving Average", come together to make a trade in the market with the highest probability of success, thus mixing the best of each analysis tool that we have at our disposal. In this way, we will use the best of a "Technical Indicator" and real-time analysis with the help of the "Price Action".
Knowing this, the combination of these tools allows us to obtain important market information, in that sense, if we use a 100 period EMA is in order that we can know the predominant direction that has the price at that specific time, with the direction I mean the trend, having this clear, we know that, if the price is above our 100-period EMA, the trend is bullish and we will only seek to enter in "Long", now if the opposite happens and the price is below the 100-period EMA, our trend is bearish and therefore we should only look for "Short" in that asset we are analyzing.
Also, to complement this strategy, we will now use our "Price Action" analysis to determine if the trend that is happening in the market is harmonic, with harmony I mean that it is making higher highs and lower lows for an uptrend and lower highs and lower lows for a downtrend. This will help me to know if I am within a valid structure in the market to be able to use what is my last tool which are the "Trend Lines", which I will use to wait for the break of the same to enter the market immediately.
La estrategia de EMA + Ruptura, se trata de que la “Acción del precio” en conjunto con el indicador técnico llamado “Media Móvil Exponencial”, entren en confluencia para poder tomar una operación en el mercado con las mayores probabilidades de éxito, mezclando así lo mejor de cada herramienta de análisis que tenemos a nuestra disposición. De esta manera utilizaremos lo mejor de una “Indicador Técnico” y un análisis en tiempo real con ayuda de la “Acción del Precio”.
Sabiendo esto, la combinación de estas herramientas nos permite obtener información importante del mercado, en tal sentido, si nosotros utilizamos una EMA de 100 periodos es con la finalidad de que podamos saber la dirección predominante que posee el precio en ese momento especifico, con dirección me refiero a la tendencia, teniendo esto claro, sabemos que, si el precio se encuentra por encima de lo que es nuestra EMA de 100 periodos, la tendencia es alcista y solo buscaremos entrar en “Largo”, ahora si sucede todo lo contrario y el precio está por debajo de lo que es la EMA de 100, nuestra tendencia es bajista y por lo tanto debemos buscar solo “Cortos” en dicho activo que estemos analizando.
Así mismo, para complementar lo que es esta estrategia, utilizaremos ahora nuestro de análisis de “Acción del precio” para determinar si la tendencia que está sucediendo en el mercado es armónica, con armonía me refiero a que este realizando máximos y mínimos más altos para una tendencia alcista y máximos y mínimos más bajos para una tendencia bajista. Esto me ayudara a conocer si estoy dentro de una estructura valida en el mercado para poder utilizar lo que es mi última herramienta que son las “Líneas de Tendencia”, las cuales utilizare para esperar la ruptura de la misma para ingresar al mercado de forma inmediata.
Role of the 100-period EMA in the EMA Strategy + Trendline Breakout | Función de la EMA de 100 periodos en la Estrategia de EMA + Ruptura de línea de tendencia
The function that has the only technical indicator that we will use in this strategy is very simple since the only function it will have is to show us the dominant direction of the trend and depending on this direction is that we as investors will take a direction to go in favor of what is the strongest trend of the market. Now, knowing this, how do we use our 100 periods EMA to know the strongest trend? To know this, we only need to observe where the price is in relation to the 100 EMA, to explain me better, pay attention to the following:
For an Uptrend: To know that we are in a clear Uptrend, the price must be above the 100-period EMA.
For a Bearish Trend: To know that we are in a clear Bearish Trend, the price must be below the 100-period EMA.
With this very simple we will be able to know the direction and consequently look for a configuration according to the strategy of the EMA + Trend Line Breakout.
La función que tiene el unico indicador técnico que utilizaremos en dicha estrategia es muy simple, ya que, la única función que tendrá la misma es mostrarnos la dirección dominante de la tendencia y dependiendo de esta dirección es que nosotros como inversores tomaremos una dirección para ir a favor de lo que es la tendencia más fuerte del mercado. Ahora bien, sabiendo esto, ¿cómo utilizamos nuestra EMA de 100 periodos para conocer la tendencia más fuerte? Para saber esto, solo debemos de observar en que posición se encuentra el precio con respecto a la EMA de 100, para explicarme mejor, presten atención a lo siguiente:
Para una Tendencia Alcista: Para saber que estamos ante una clara Tendencia Alcista, el precio debe estar por encima de lo que es la EMA de 100 periodos.
Para una Tendencia Bajista: Para saber que estamos ante una clara Tendencia Bajista, el precio debe estar por debajo de lo que es la EMA de 100 periodos.
Con esto muy simple podremos saber la dirección y consecuencia buscar una configuración de acuerdo a la estrategia de la EMA + Ruptura de Línea de Tendencia.
Role of the "Trend Line" in the EMA + Trend Line Breakage Strategy | Función de la "Línea de Tendencia" en la Estrategia de EMA + Ruptura de línea de tendencia
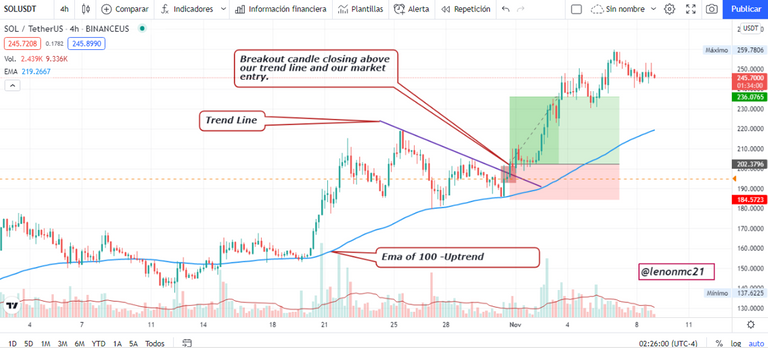
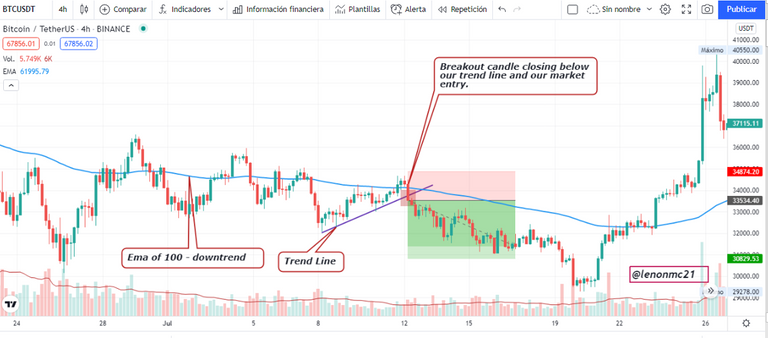
The main function of the trend line in the strategy is to trigger the entry of the "Buy and/or Sell" trade once it has been broken. However, this trend line is not drawn as everyone should think, since, for an uptrend, if the price is above the EMA of 100 periods, we will join with a trend line the highest points of the price that are increasingly lower, that is, we will draw in an uptrend a downtrend line, which happens only in the price retracement very close to what is the EMA.
At that time and once the price is very close to the EMA and you have already painted your trend line, we will wait for the breakout of the same upward and also the candle breakout, close above our trend line, this is the exact time of entry into the market. To make this clearer and not just stay with the theory, I will show some clear examples in the next section of how it should be applied.
La línea de tendencia en la estrategia, tiene como función principal, dar el gatillo de entrada a la operación de “Compra y/o Venta” una vez la misma haya sido quebrada. Sin embargo, esta línea de tendencia no se traza como todos deben de pensar, ya que, para una tendencia alcista, si el precio se encuentra por encima de la EMA de 100 periodos, uniremos con una línea de tendencia los puntos mas altos del precio que son cada vez mas bajos, es decir, que trazaremos en una tendencia alcista una línea de tendencia bajista, la cual sucede solo en el retroceso del precio muy cerca de lo que es la EMA.
En ese momento y una vez el precio se encuentra muy cerca de la EMA y ya tienes pintada tu línea de tendencia, esperaremos la ruptura de la misma al alza y que ademas la vela de ruptura, cierre por encima de nuestra línea de tendencia, este es el momento exacto de entrada al mercado. Para que esto quede mas claro y no solo se queden con la teoría, mostrare unos ejemplos claros en la siguiente sección de cómo debe aplicarse.
Graphical examples of all elements of the strategy at work | Ejemplos Graficos de todos los elementos de la estrategia en funcionamiento.
Conclusion
This is a simple and easy-to-use strategy, it only requires practice, which is called "Backtesting", this is more than enough to be able to get some profitability to the market in any season and for any asset. On the other hand, we must be sure to risk a maximum of 2% of our capital per operation, personally, I recommend 1% and of course seek a 2% or 3% profit, which would be a risk/reward ratio of 1-2 or 1-3.
Esta es una estrategia sencilla y fácil de utilizar, solo requiere de práctica, lo que se llama el “Backtesting”, con esto es mas que suficiente para poder sacarle algo de rentabilidad al mercado en cualquier temporalidad y para cualquier activo. Por otro lado, debemos asegurarnos de arriesgar como maximo un 2% de nuestro capital por operación, personalmente recomiendo el 1% y por supuesto buscar un 2% o 3% de ganancias, lo que seria una relación de riesgo y beneficio de 1-2 o 1-3.

If you are new you can join the game under this LINK

@tipu curate 5
Upvoted 👌 (Mana: 0/100) Liquid rewards.