LeoFinance Weekly Stats 06/06/2022 to 06/12/2022
Welcome to the weekly edition of the LeoFinance stats report.
This is a weekly report covering June 6th through June 12 2022.
If you want to learn a bit more about the LeoFinance ecosystem and dig into the numbers, this is the place to be.

The following topics will be covered:
- Issued LEO Tokens
- Top LEO Earners
- Rewards to HP delegators trough the leo.bounties program
- Daily stats on tokens staking
- Share of tokens staked
- Top Users that staked
- Unique number of LeoFInance users
- Posts/comments activities on the platform
- Posting from LeoFinance.io interface
- Price Chart
Issued LEO Tokens
Let’s take a look into token issuance and how it is distributed over time.
Below is a chart that represents the cumulative issued LEO tokens.
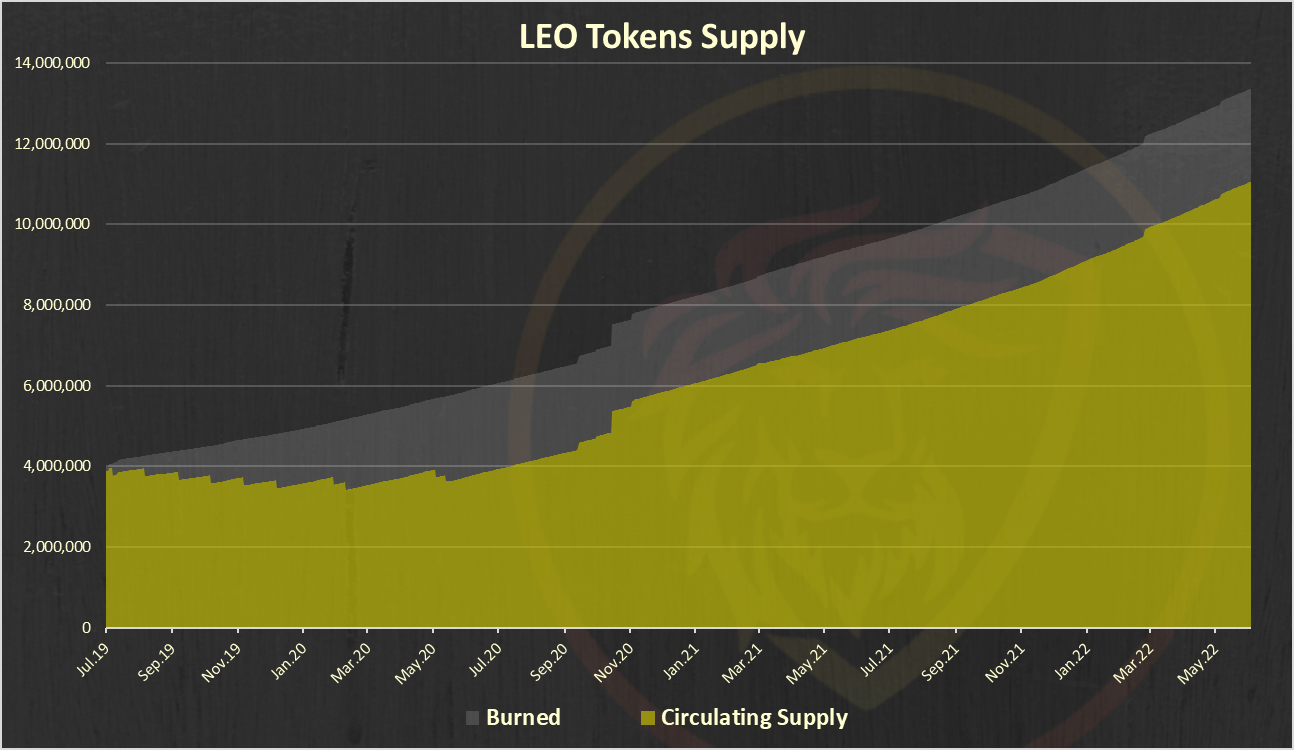
This chart is representing the total LEO supply, circulating supply and burned tokens.
A total of 13.36M issued LEO tokens, 2.3M burned, 11.06M circulating supply.
Next is the issued LEO tokens from last week. Here is the chart:
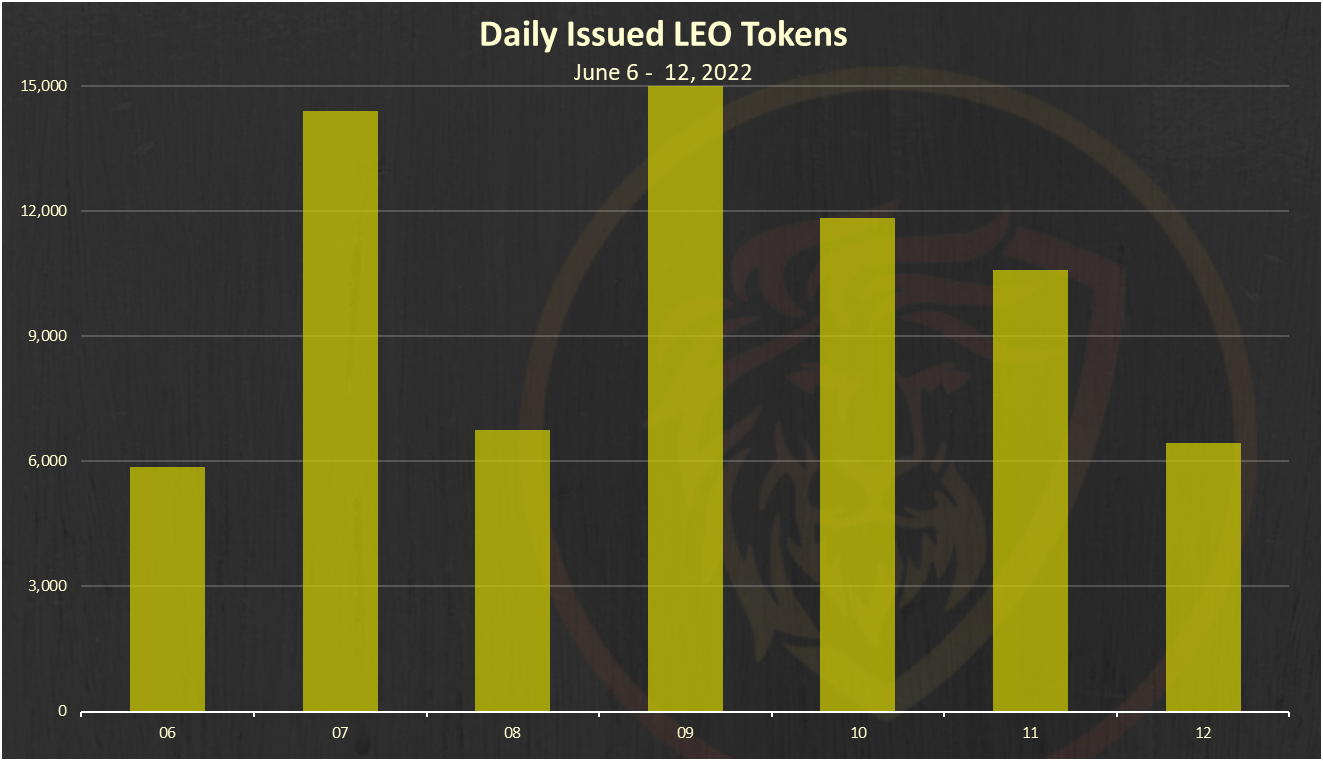
A total of 78k LEO were issued in the last week.
Let’s see how these tokens were distributed.
Below is the chart of the top 10 LEO earners this week.
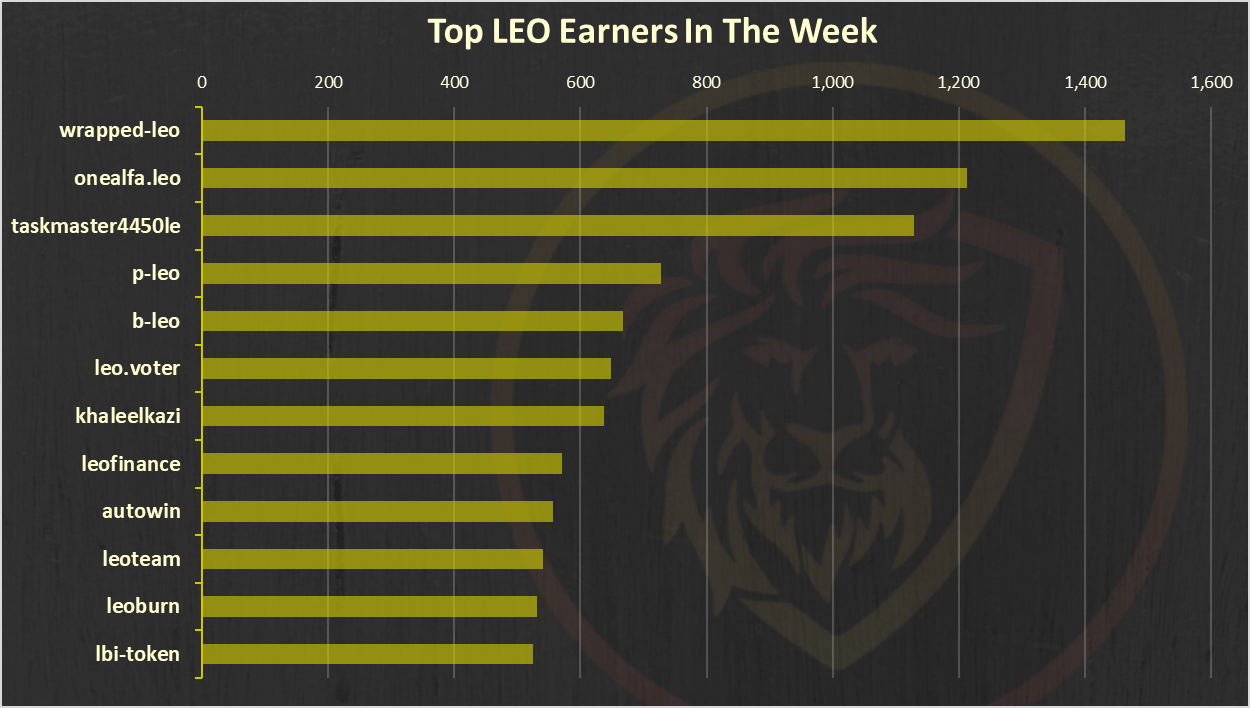
The official @wrapped-leo account that holds LEO on the ETH chain is on the top.
Rewards from Bounties
Users who delegate their HP to the @leo.voter receive daily payouts in the form of LEO tokens at a rate of ~16% APR. Also, at time some other bounties are in place.
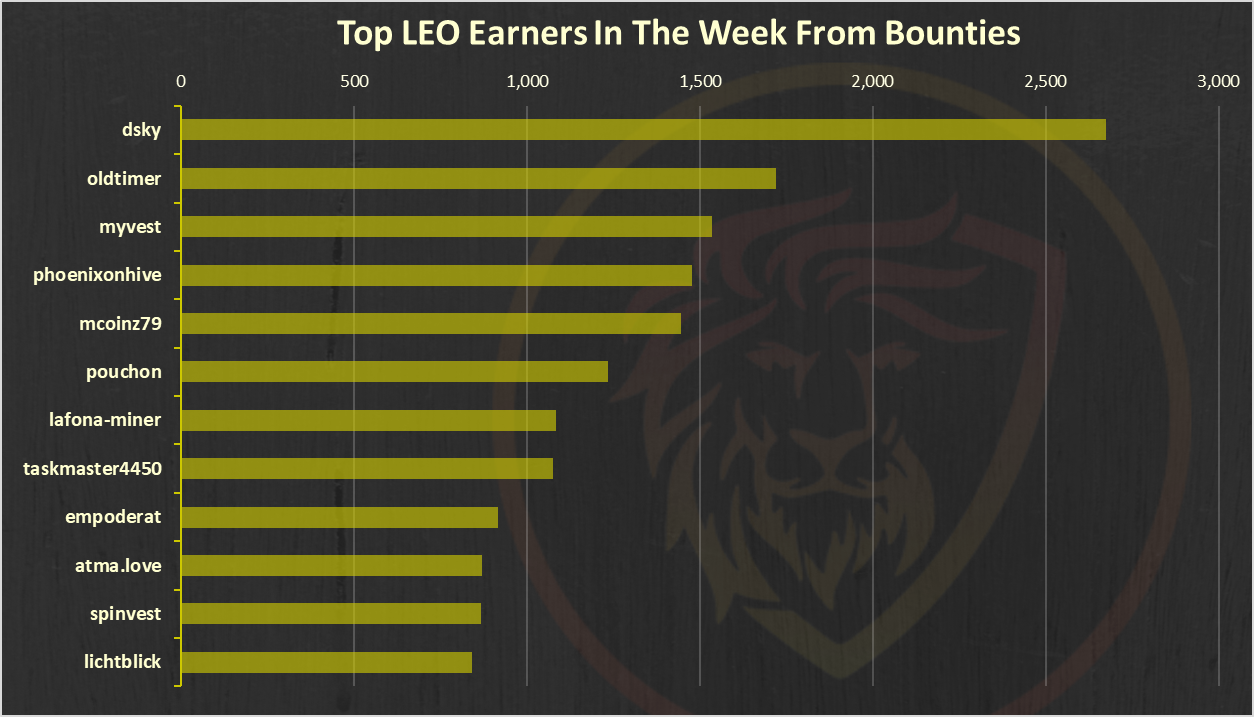
@dsky is on the top here, followed closely by @oldtimer.
Staking LEO
Below is a chart that represents the monthly flow of staked and unstaked LEO tokens. A positive bar going up shows a day where more LEO was staked than unstaked.
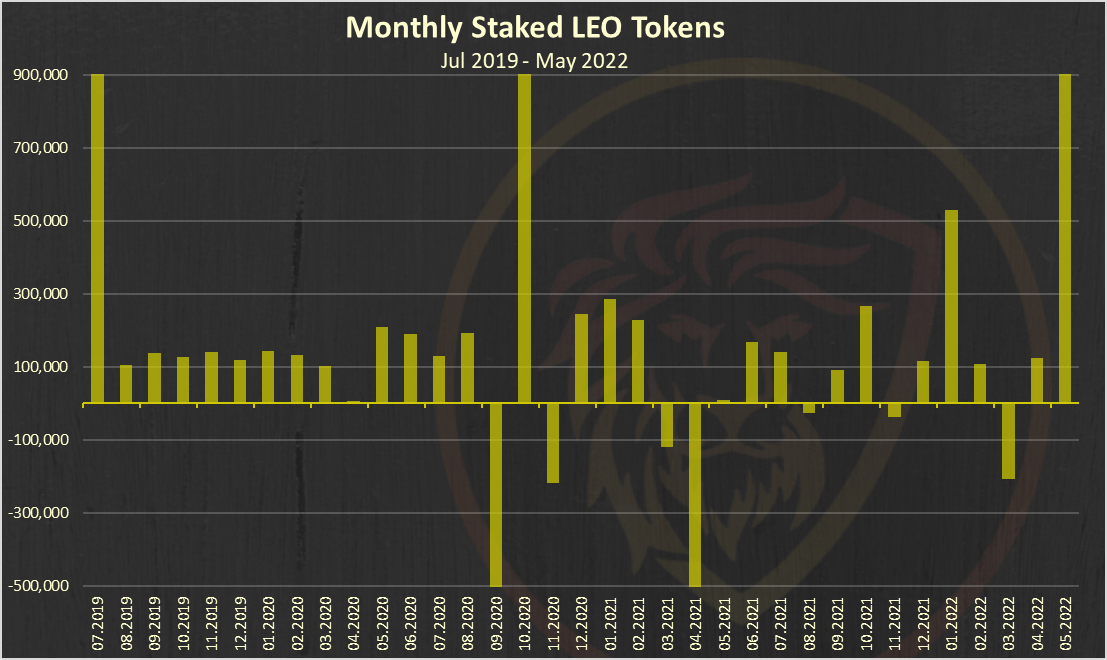
May has an amazing 2.4M LEO staked, but those come from the official leo accounts that hold the bridged leo tokens to the other chains, like ETH, BSC and Polygon, where 50% of the tokens is now staked.
Below is the chart of the top 10 users that staked LEO last week:
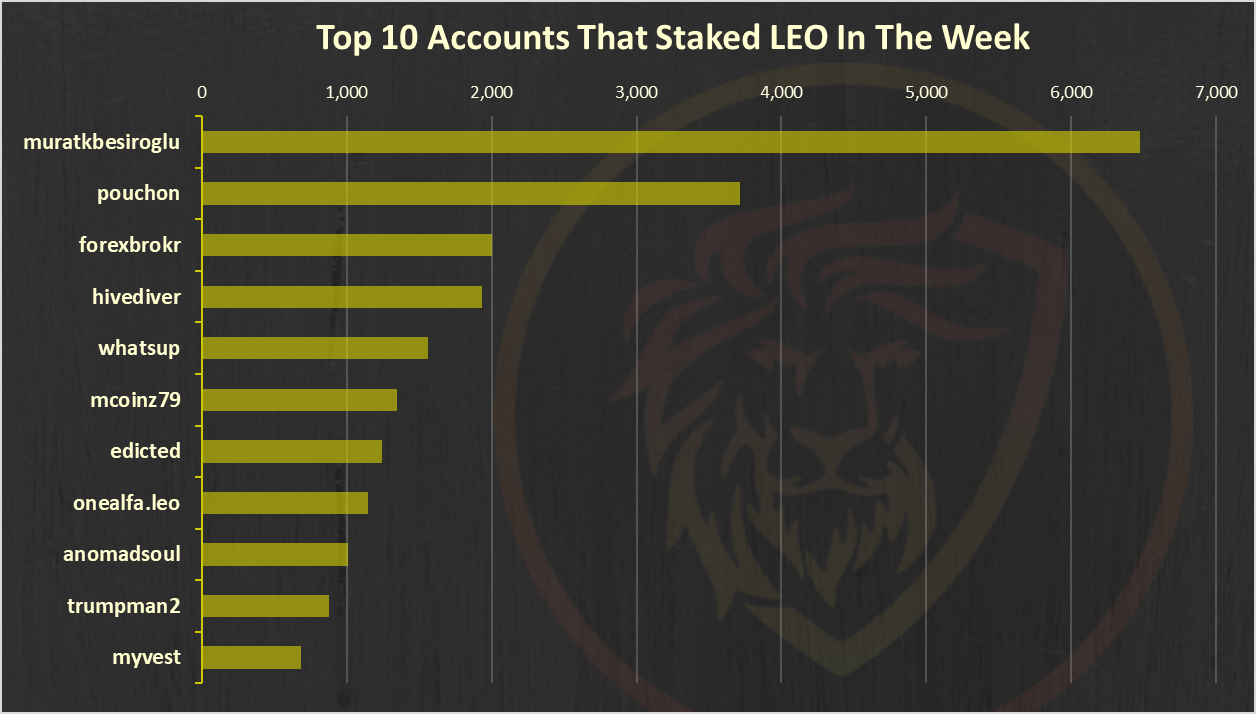
@muratkbesiroglu is on the top here.
The Overall Flow of the LEO Token Supply:
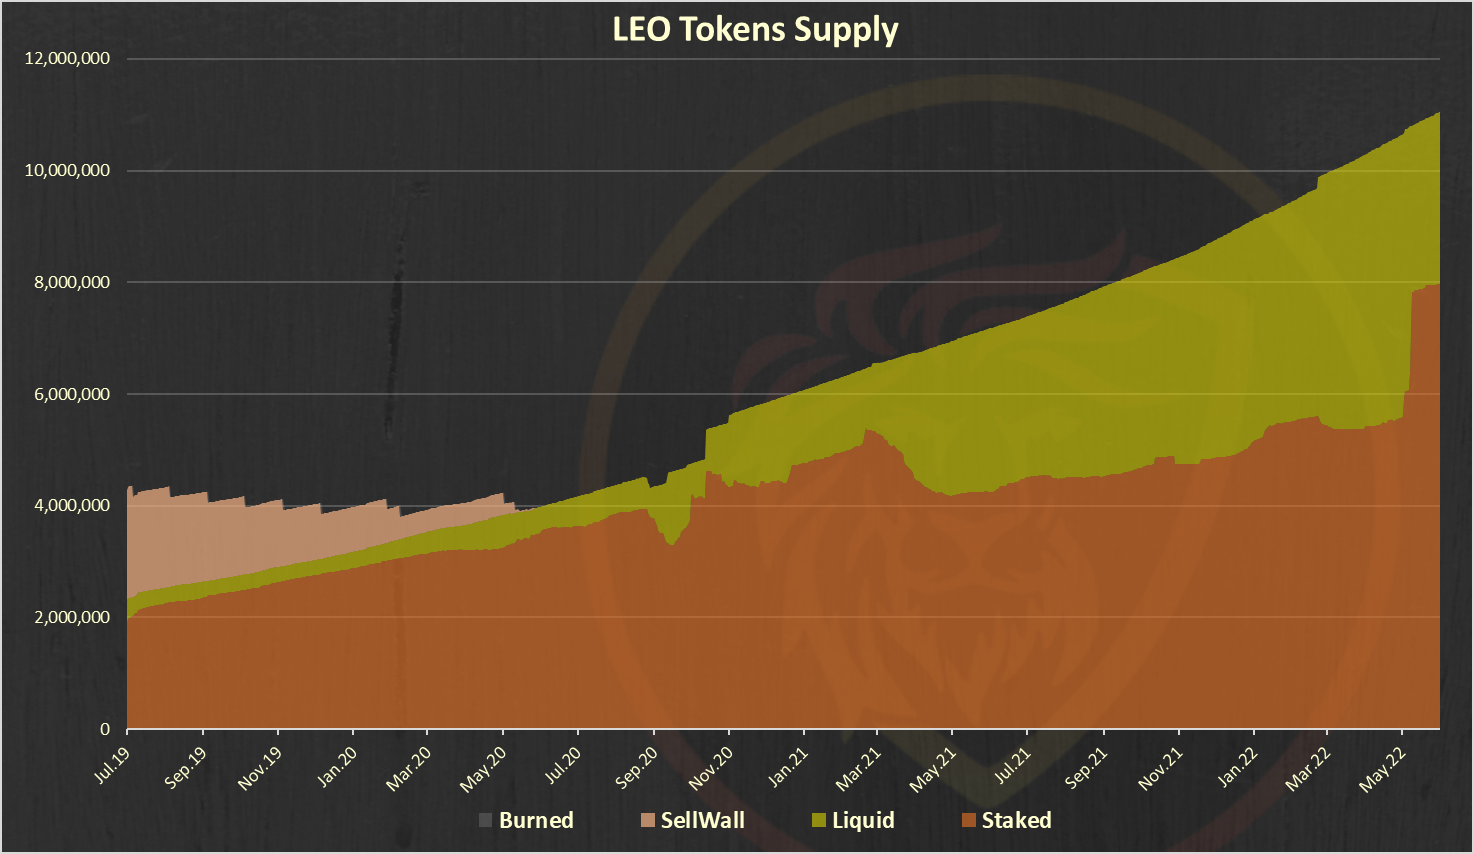
Note on the yellow, liquid category above. It includes the LEO in the liquidity pools on ETH and BSC as well. If we remove that, the liquidity will be much lower.
Below is a chart of the LEO tokens allocation.
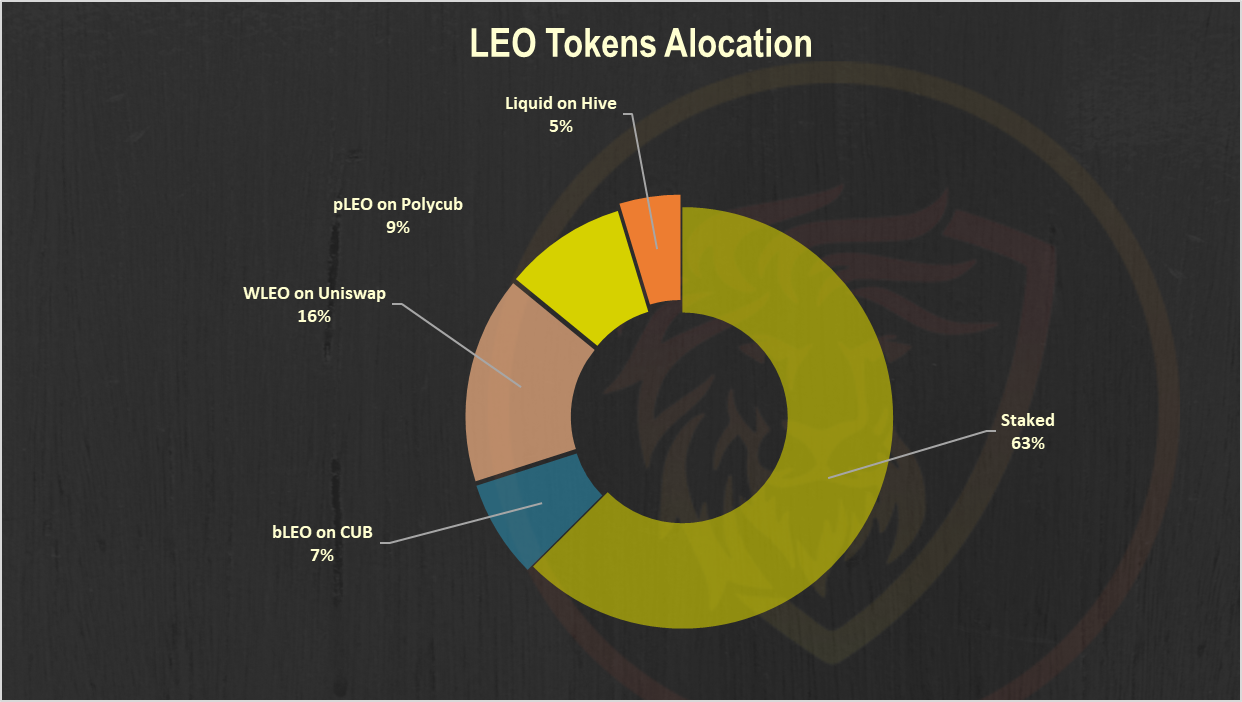
A 63% share staked.
LeoFinance Users
Below is a chart with the number of unique users that posted from the LeoFinance frontend.
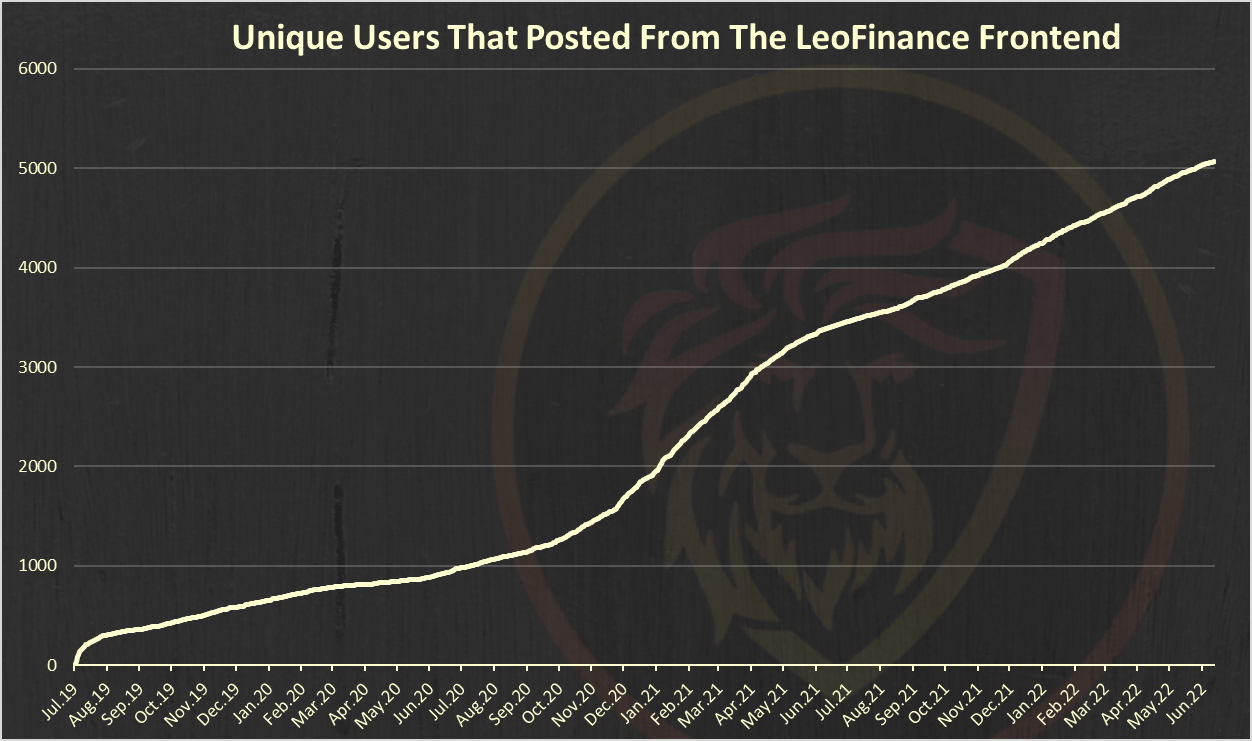
A 5k unique accounts have posted from the LeoFinance interface.
Monthly Active Users Posting and Commenting from LeoFInance [MAU]
Here is the chart for the monthly active users that posted from the leofinance.io interface.
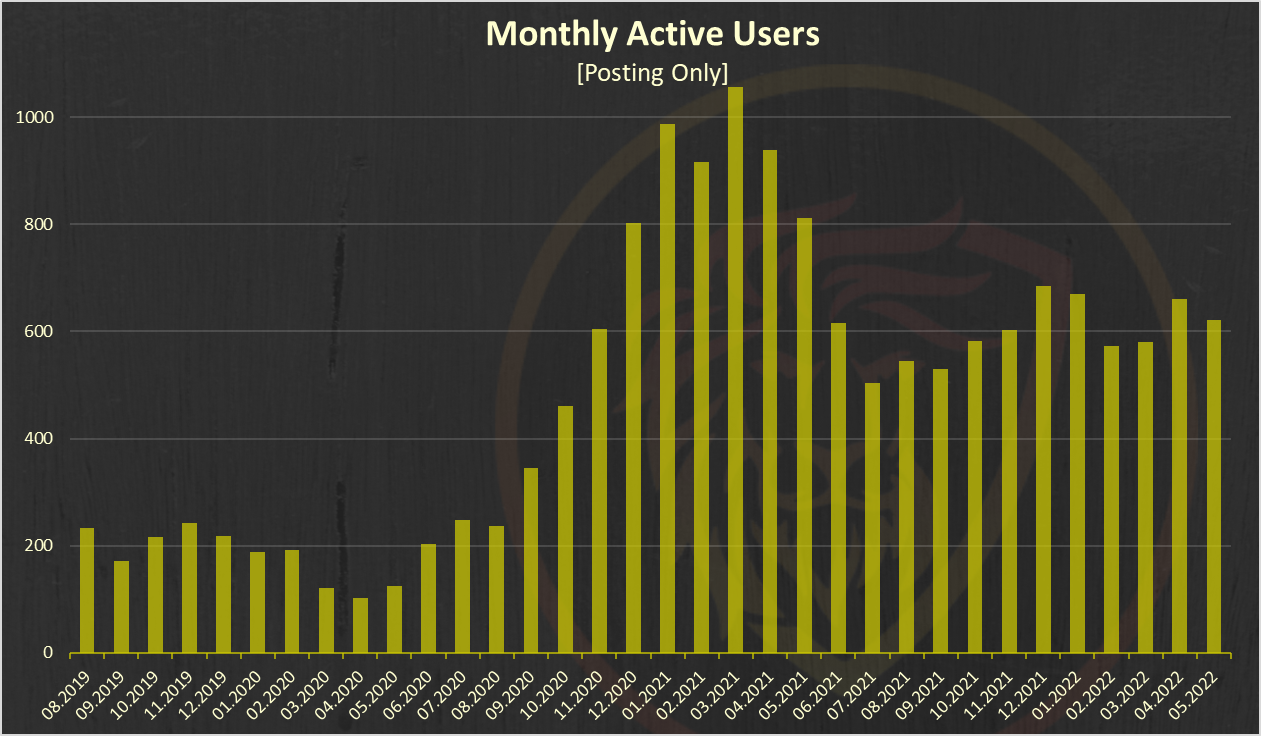
May is very similar in the numbers of accounts that posed as April with 622 accounts.
Users That Commented Only
Here is the chart for users that commented from leofinance.io, but didn’t make a post in the month.
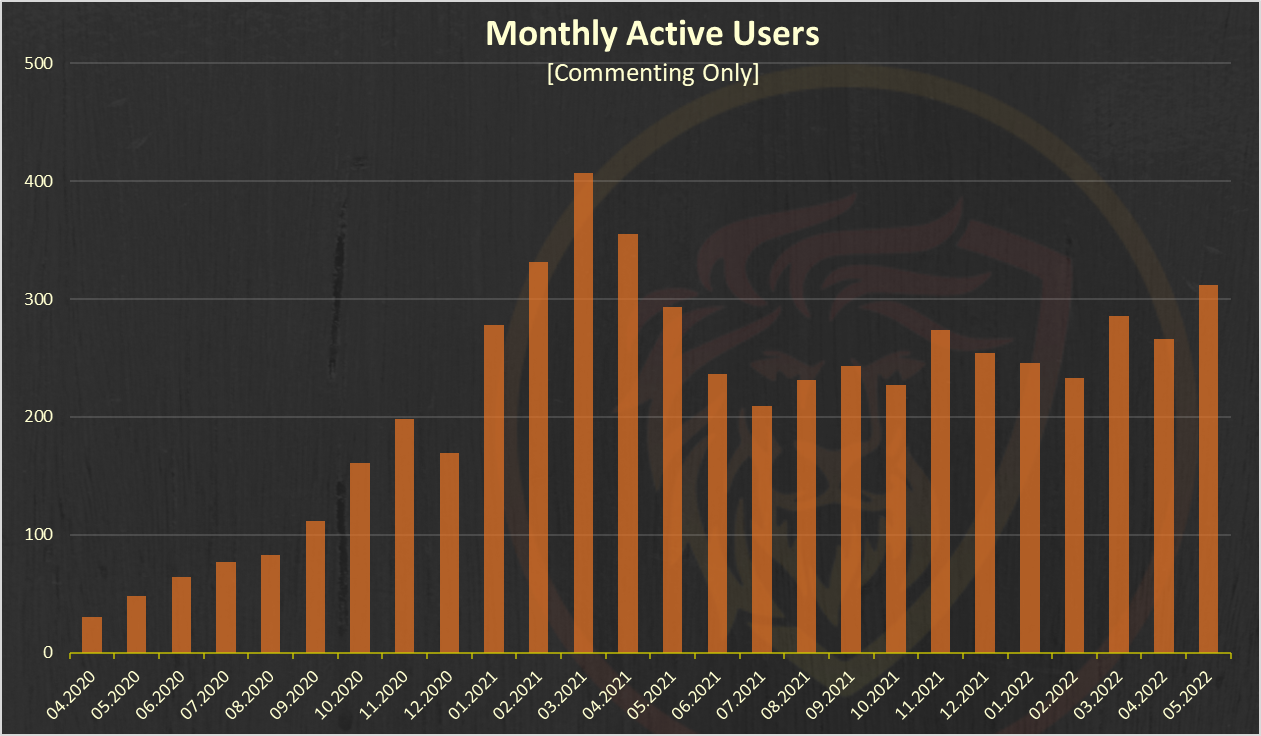
On the comment side there is 312 accounts that only commented on Leofinance in May without making a post. The numbers of these accounts is slightly up compared to April.
Activities on LeoFInance
Below is a chart of the LeoFinance activities with the numbers of posts from the LeoFinance interface and posts with the #leofinance tag.
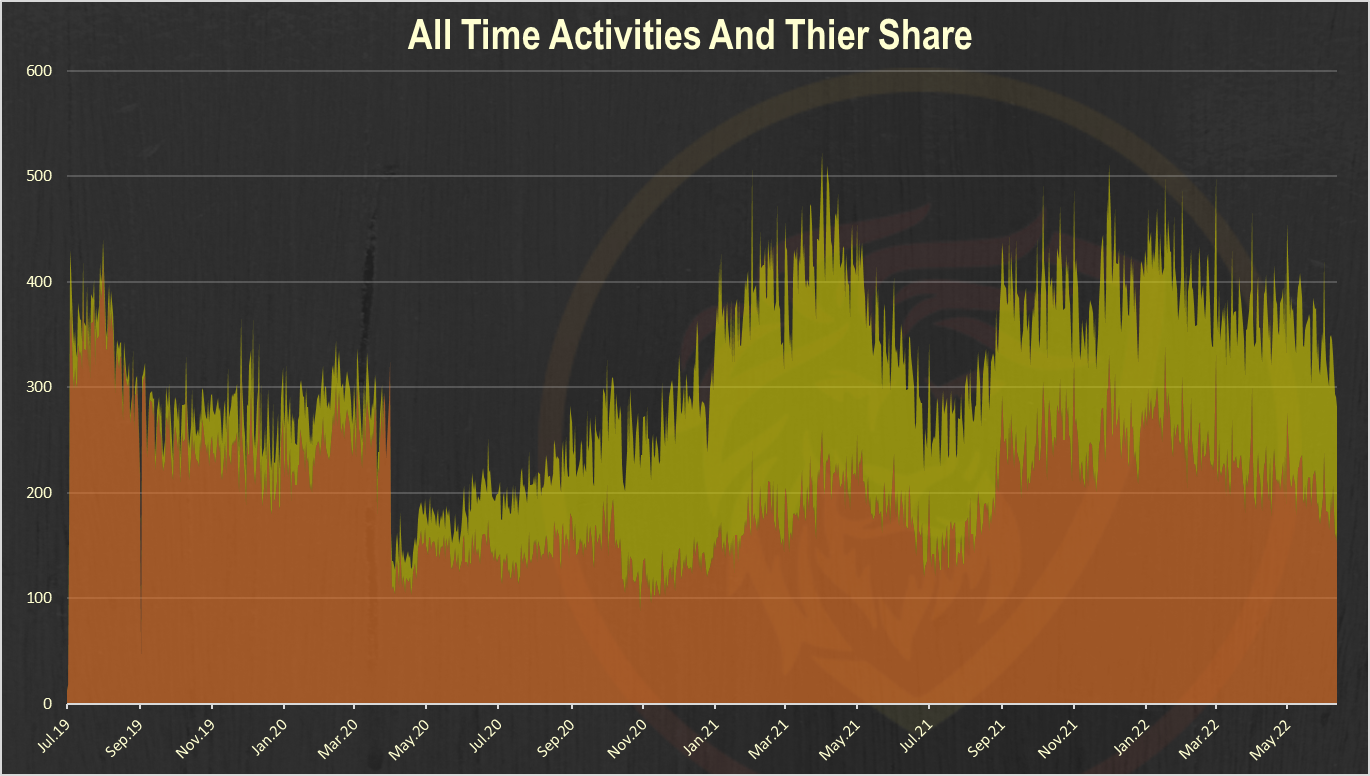
The yellow are posts from the leofinance interface and the orange posts from other hive frontends with the leofinance tag.
The number of daily posts has been around 150 in the last period.
LeoFinance has a 20% incentive for posting trough the native frontend. When users post from other frontends and just with the leofinance tag they have 20% less rewards.
Number of comments from LeoFinance.io
Here is the chart for the numbers of comments starting from April 2020.
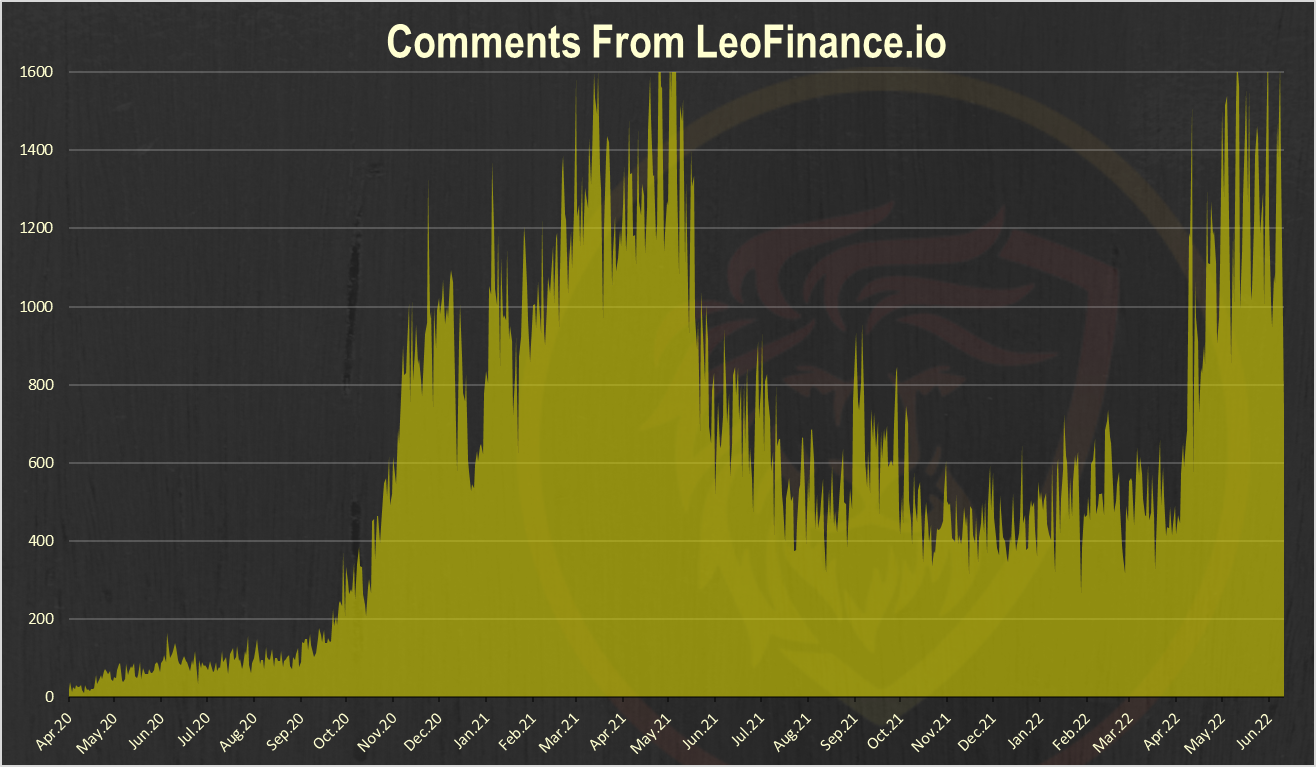
A total of 8.5 comments in the previous week!
Authors that commented the most
There is an initiative in the last period for engagement on the platform and some of the large stakeholders have been voting comments a lot.
Here are the top authors that commented the most.
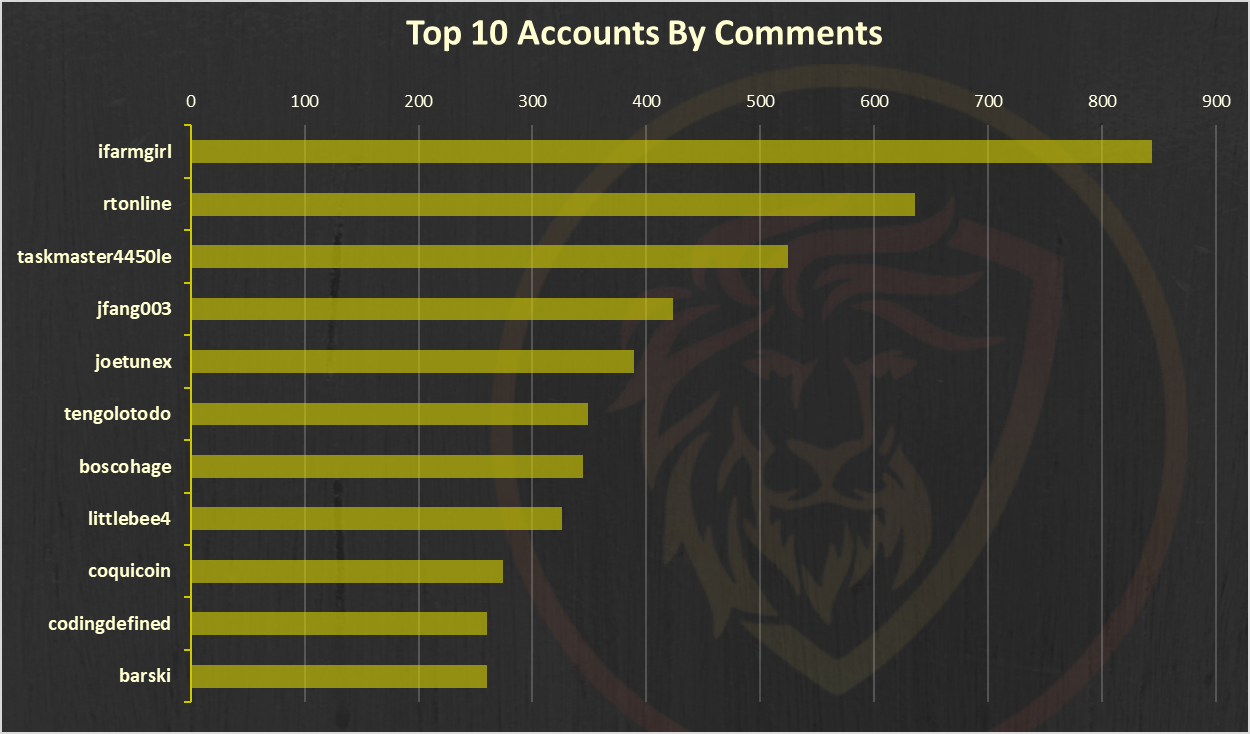
@ifarmgirl is on the top now.
Price
All time LEO price
It is interesting to look at the LEO token price, keeping in mind the crazy ride that HIVE had in the previous month.
Here is the price chart in dollar value with average price for better visibility.
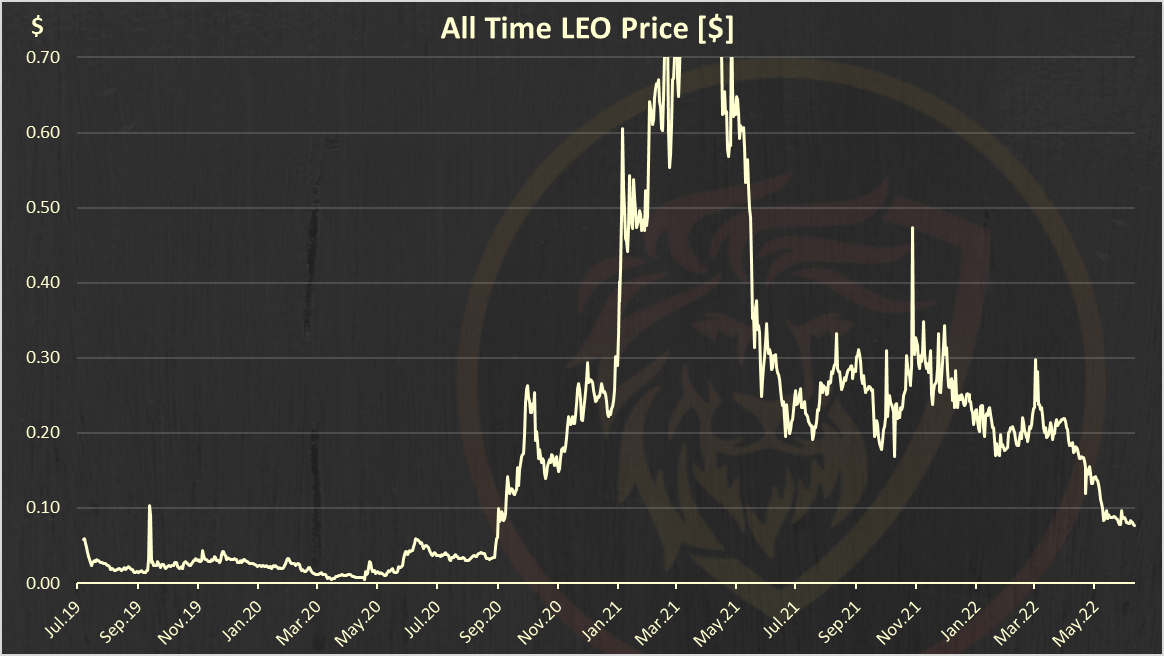
Have in mind the above is an average daily price.
LEO price in the Last 30 days
Here is the price of LEO in the last 30 days also in dollar value:
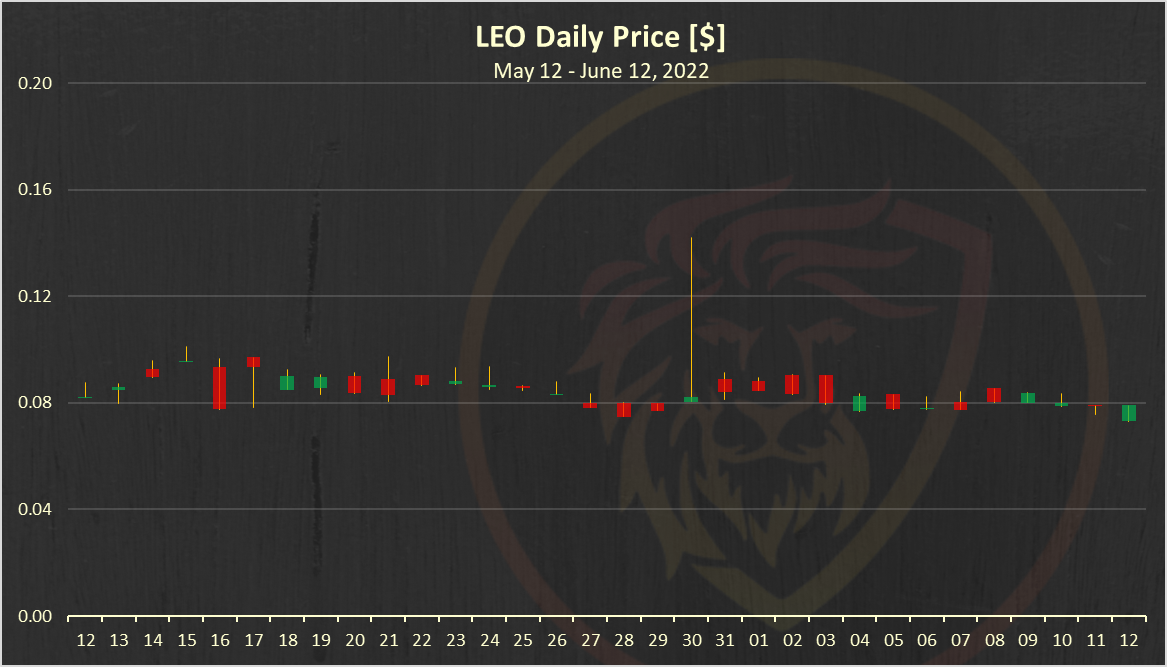
This is data from hive engine.
LEO is now in a downtrend following the overall market conditions.

| Track Hive Data | New Interface! | About Us |
|---|---|---|
| Hivestats | LeoFinance Beta | Learn More |
 |  |  |
| Trade Hive Tokens | Wrapped LEO | Hive Witness |
|---|---|---|
| LeoDex | Trade on Uniswap | Vote |
 |  |  |

Report by @dalz
Posted Using LeoFinance Beta
Very impressed with these great numbers, let's hope to improve them for the next report :D
Posted Using LeoFinance Beta
with the staking challenge these #'s will improve
Posted Using LeoFinance Beta
It's pretty wild how Hive has the lowest liquidity out of them all and trust me I see that on the daily when going to try and buy some.
Posted Using LeoFinance Beta