$Hive poised to correct towards 0.44-0.45 level. It might potentially reverse the lost ground(0.55-0.28) completely in December!
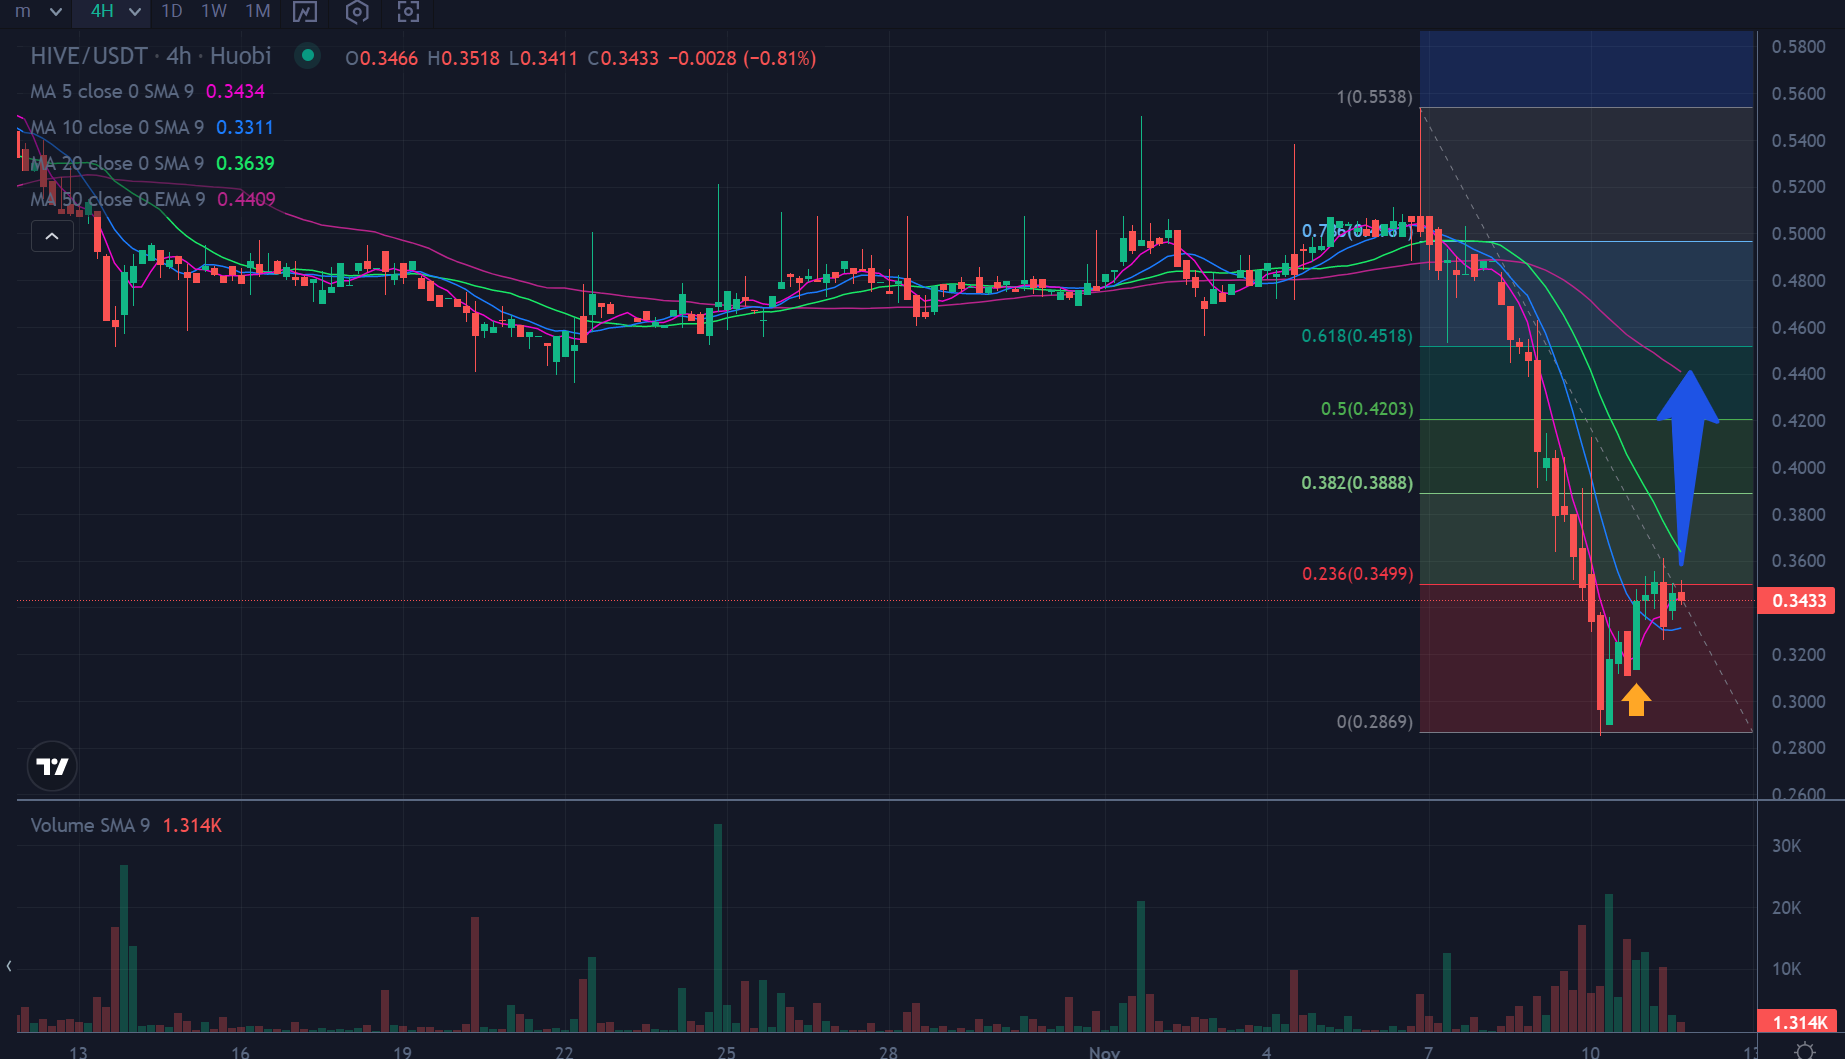
In the H4 chart, $Hive has already formed a low and consolidating above it. Any successful attempt to correct higher will be challenged by 0.44 region
Chart Courtesy: Tradingview
$Hive is one of the few coins which proved to be the most resilient in this cycle, even during the bear cycle it succeeded to defend the 0.33 level earlier. And made several mini spikes during the phase of consolidation. I am sure the TA traders have benefitted and made money from such a protracted range of Hive.
However, during the second leg of the bear run, it nosedived to the $0.28 level, but the good part is that it quickly rebounded to stage a decent rally, appreciated 25% from the low, currently hovering around the 0.35 level. The M30 has already formed a higher low, and the H1 and H4 chart structures are improving.
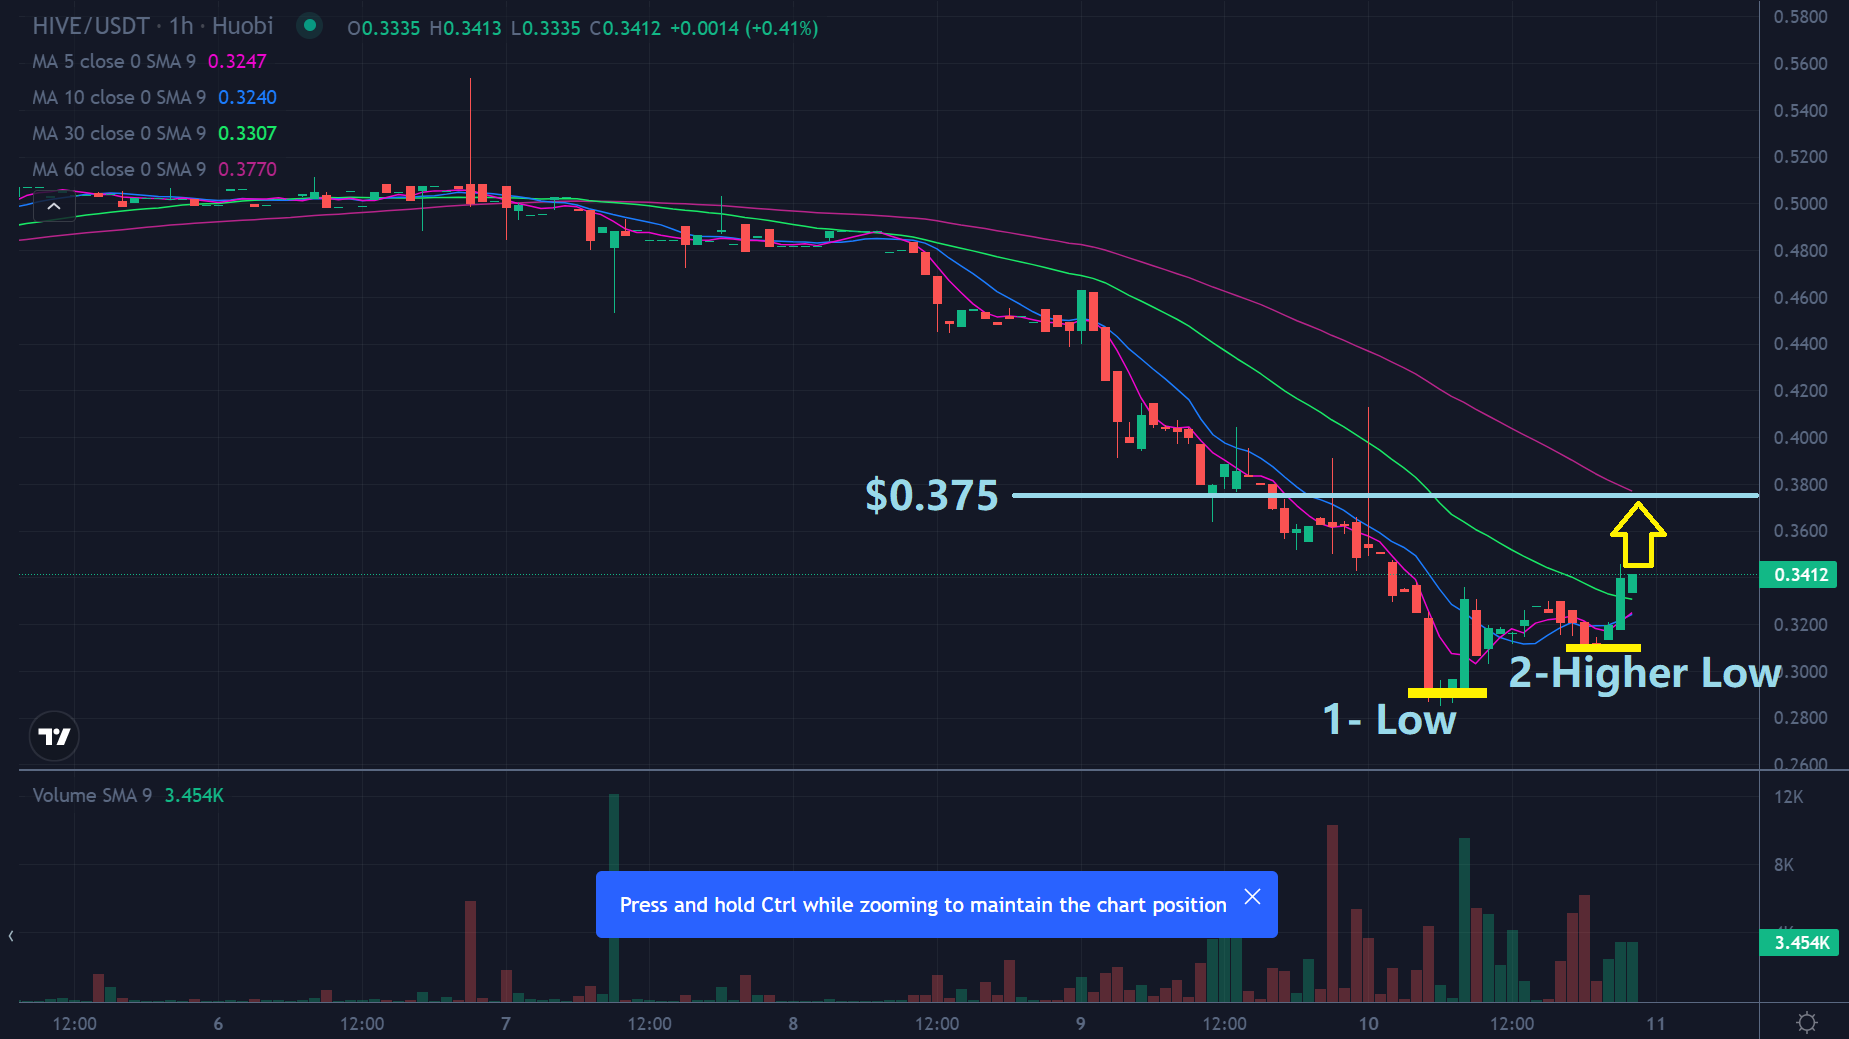
In the M30 chart, HIVE has already produced a high low and consolidating above it.
Chart Courtesy: Tradingview
For Hive to make more upward push it needs to conquer the 0.37 level which is the 20 SMA. The next hurdle will be the 0.44-0.45 zone which is the confluence of 50 EMA and 61.8% Fibonacci level.
If you closely observe the chart structure one thing that is quite clear is that 0.45 was the base of the previous consolidation phase, which means every time Hive touches 0.45 it has bounced off. But as Hive has already plunged below the 0.45 zone decisively in this second leg of the bear run, this 0.45 zone would be the new resistance level. And perhaps it has opened up a new trading zone that is 0.31 to 0.44 zone. I have taken 0.31 as the lower range because it is the second higher low on the M30 chart. And 0.44 is the upper range because it was the previous base.
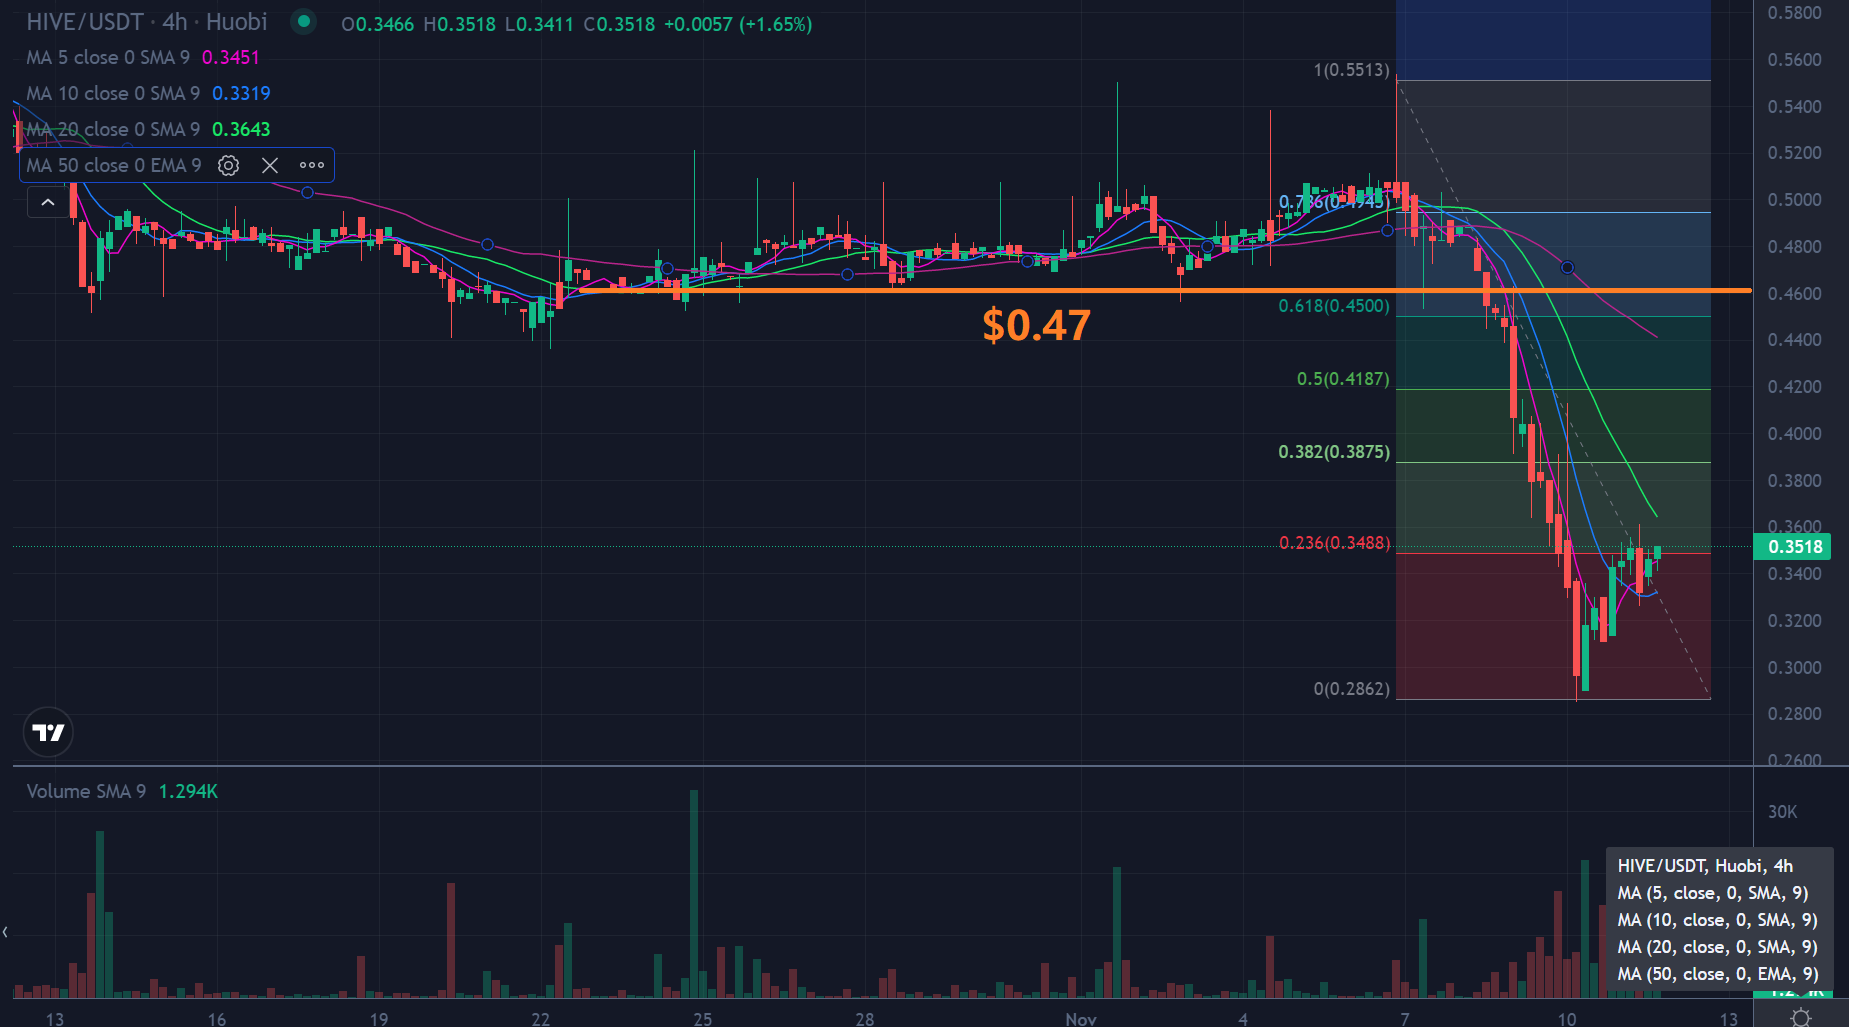
Fibonacci retracement levels in H4 chart for $Hive.
Chart Courtesy: Tradingview
Now let's go to the H4 chart. Here if we draw the Fibonacci level, which is 0.55 to 0.2878 as shown in the chart, the different Fibonacci levels would be the area of inters/liquidity zones. The immediate area of interest would be 0.39(38.2%) followed by 0.42(50%). The corrective waves might at least go towards 50% of the Fibonacci level, usually in a violent drop 50% Fibonacci correction is the usual thing.
That said, it also depends on the broader market sentiment including the temper of the traditional market. As we all know CPI(US) is missed by a big margin. The Fed has been very hawkish over the past few months, they might be forced to moderate their hawking tone and that will certainly cause USD to suffer and the counterparts like EUR, GBP AUD, GOLD, etc will make a massive rally in that case. GOLD is already strongly bullish anticipating this scenario.
Another point is that December month has always been generous both for crypto and for the traditional market. It's always been merrier for all. So it has been that tradition for a long time. Considering 2022 has been largely bearish, we might see some massive relief rally all across, in that case, BTC and the entire crypto space might rally and in that case, it will be the perfect homecoming for crypto.
So if we combine all these factors to analyze/predict the next move for Hive then we have reasons to cheer and it may prove to be not just a corrective rally towards $0.45, but rather beyond it.
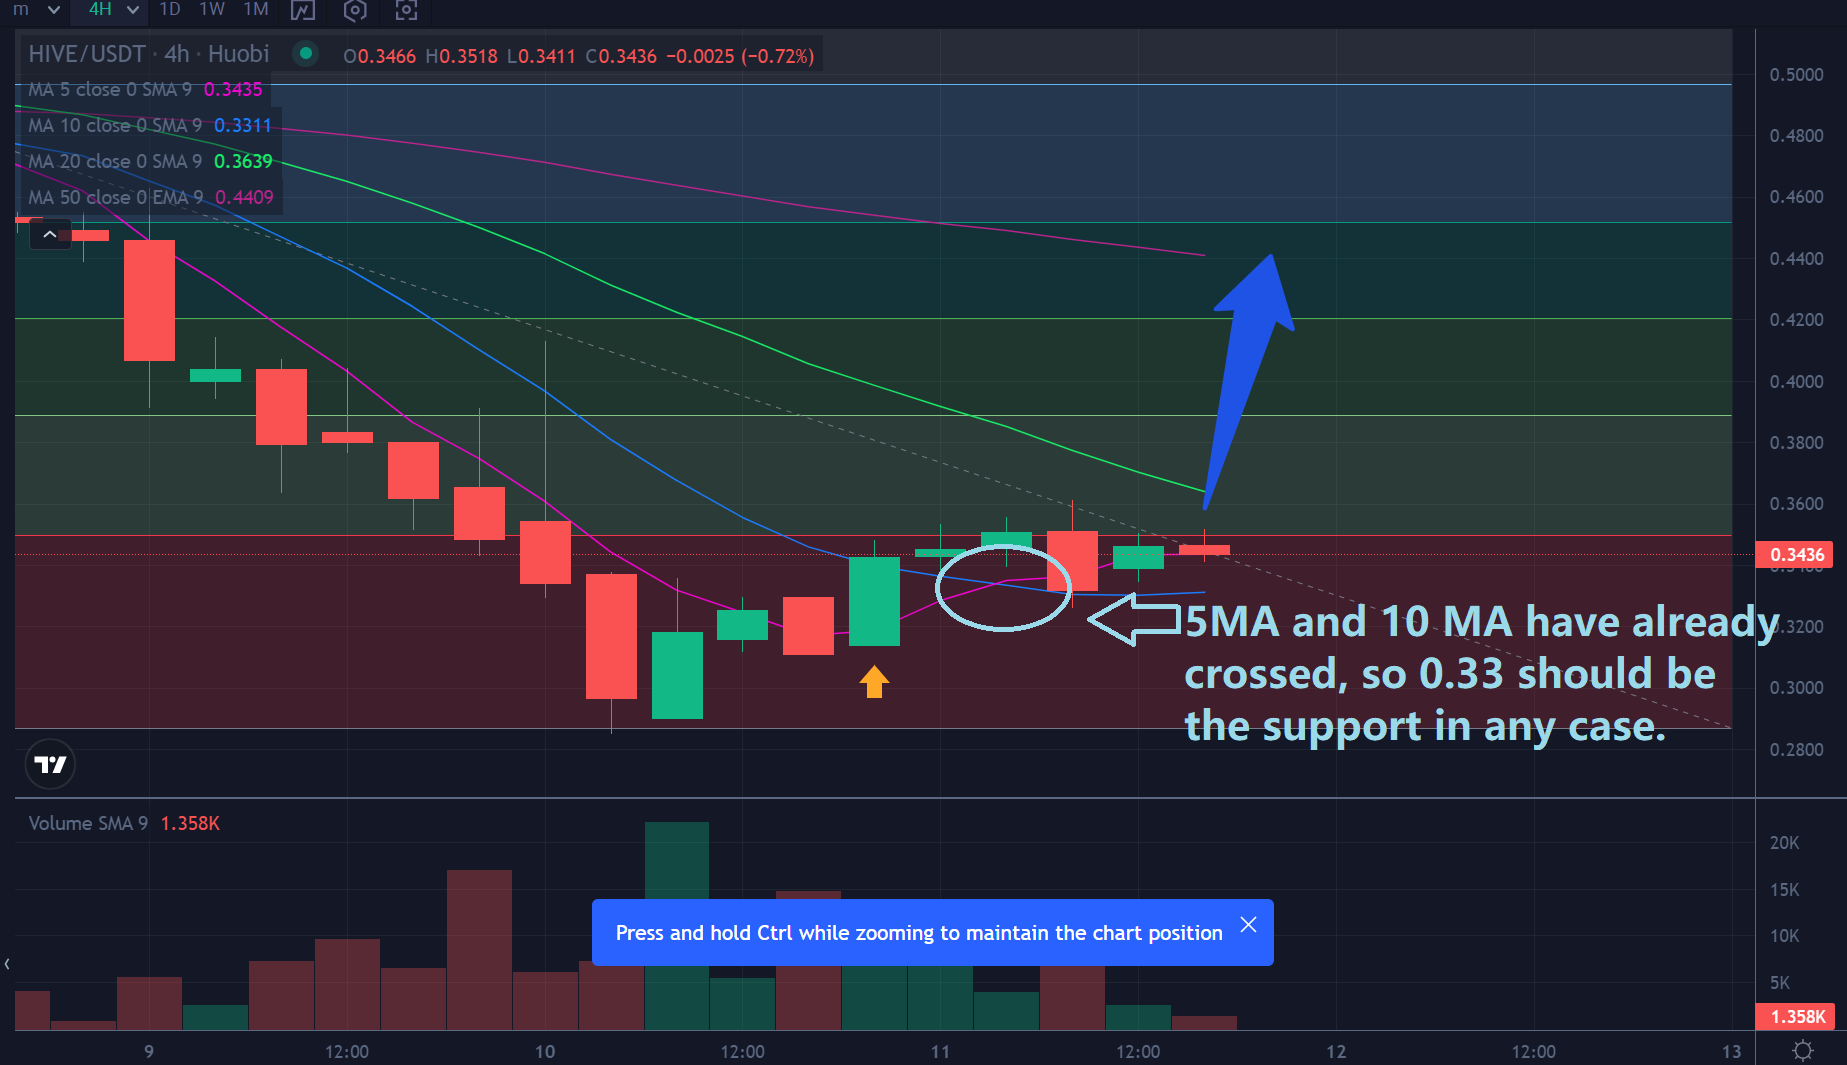
In the H4 chart, 5MA and 10MA has already crossed, so it may likely to offer immediate support to $Hive.
Chart Courtesy: Tradingview
In the H4 chart, the immediate support line is 0.33. And the upside is poised for a spike to the 0.44-0.45 zone, should it hold that support line. This is so due to the fact that in H4, 5 and 10 MA have already crossed, and this zone, i.e. 0.33 should offer support and HIVE if it continues to defend this zone in the upcoming sessions, can easily recover the lost ground in the short term.
Now, finally, let's move into the Daily chart of HIVE.
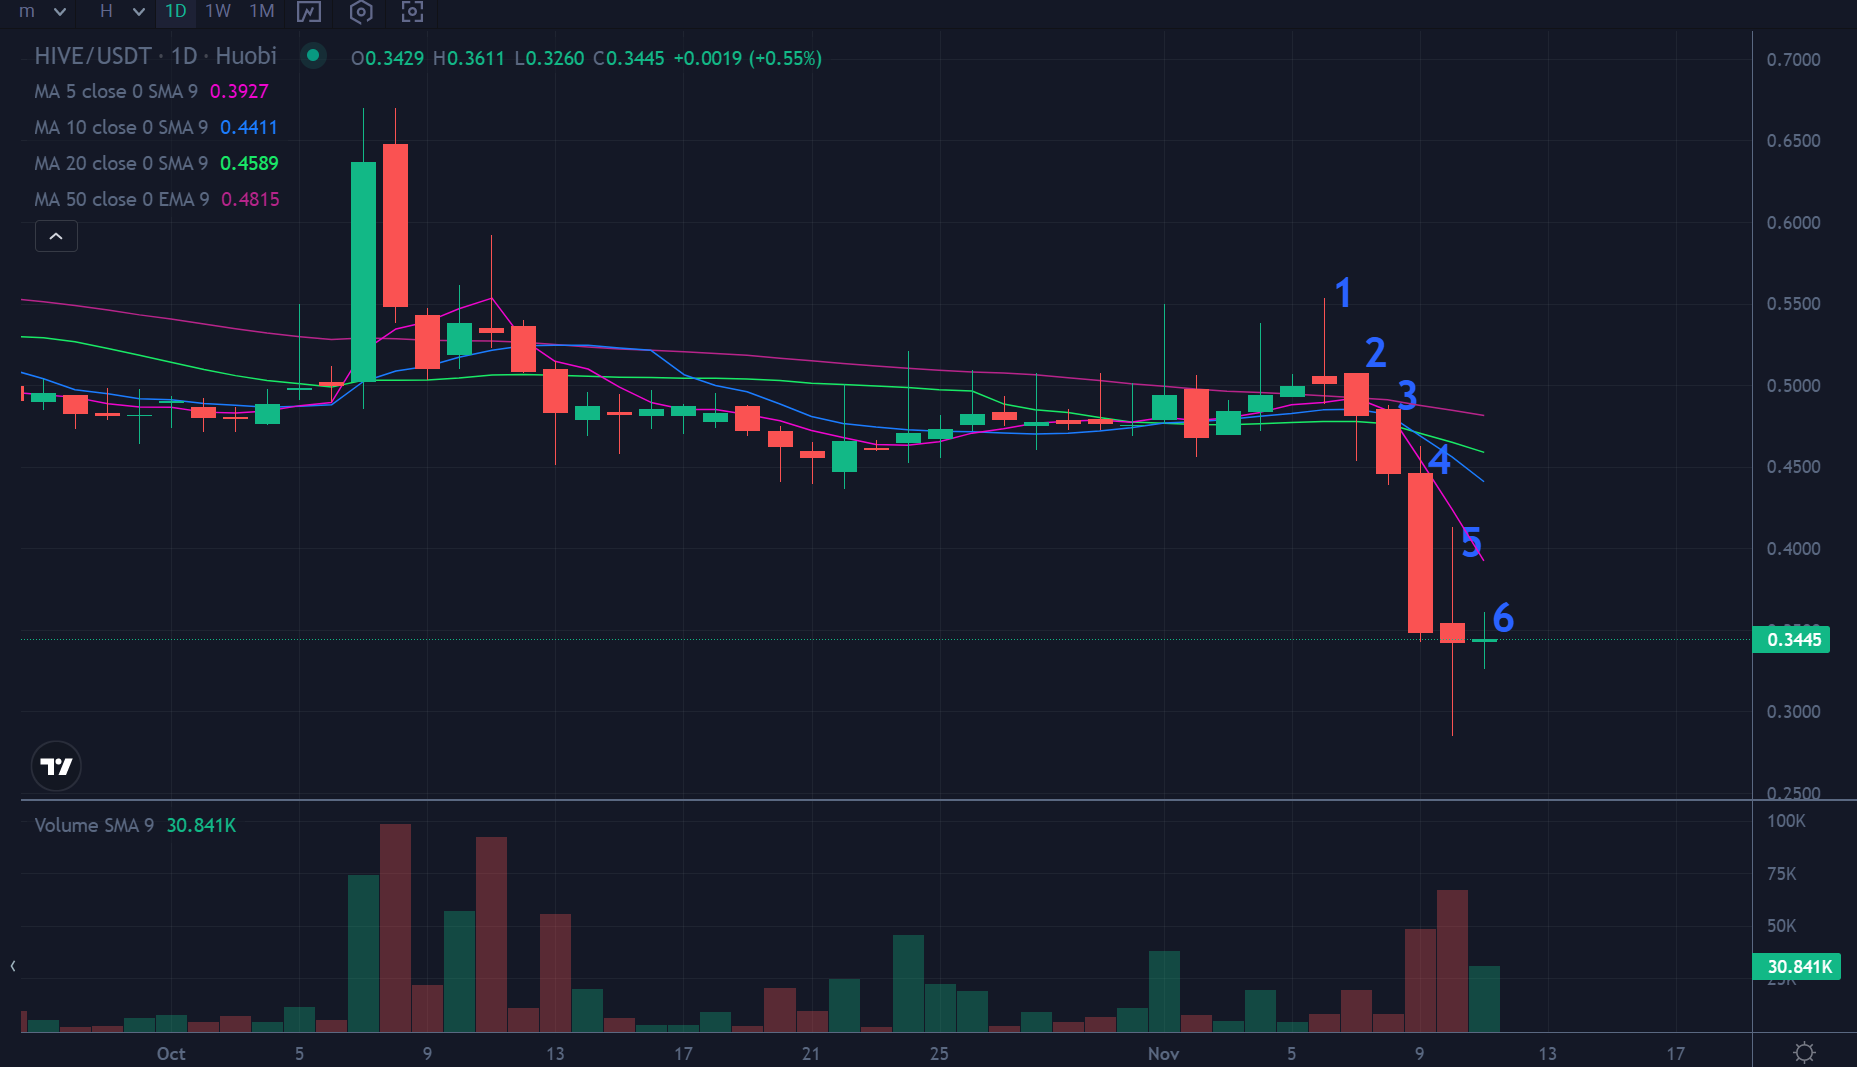
D1 chart of $Hive
Chart Courtesy: Tradingview
There are 5 consecutive red candles of this recent bloodbath.
- Candle 1= Range(0.55-0.49)= 0.06
- Candle 2= Range(0.51-0.46)= 0.05
- Candle 3= Range(0.48-0.44)= 0.04
- Candle 4= Range(0.46-0.34)= 0.08
- Candle 5= Range(0.41-0.29)= 0.012- Almost a pin bar
- Candle 6= Range(0.36-0.32)= 0.04-- Still on
After 5 consecutive bearish sessions, Hive looks to find some support and tries to consolidate around the 0.32-0.33 zone in the daily chart.
Look at the different ranges of the daily candles from 1 to 5. Candle no 4 and 5 were quite violent and Candle no 6 is already green but not yet closed, if this candle closes as a green candle, then we may have to look for at least two follow-through candles and if it manages to produce green candle above 0.45 and also closes above it in the daily chart, then it will certainly reverse the entire lose ground and will again start trading above 0.50.
Considering the fact that Crypto has largely mirrored the sentiment around the traditional market and considering that we are fast approaching December, a rally is certainly due; it's just a matter of time. So I will stick to my claim that those who bought around 0.30 were lucky and we might not see this level again in Jan/Feb of 2023. HIVE from here has definitely more room to go up than to fall.
EMA- Exponential Moving Average
SMA- Simple Moving Average
Disclaimer:- This article is intended for educational and analytical purposes only. It should not be construed as financial advice. Thank you.
Posted Using LeoFinance Beta
https://twitter.com/1331330355513745413/status/1591079189897412609
The rewards earned on this comment will go directly to the people( @taskmaster4450le ) sharing the post on Twitter as long as they are registered with @poshtoken. Sign up at https://hiveposh.com.
Yay! 🤗
Your content has been boosted with Ecency Points, by @milaan.
Use Ecency daily to boost your growth on platform!
Support Ecency
Vote for new Proposal
Delegate HP and earn more
To me I think I will wait for the market too go above 200 moving average on 30m before confirming the market actually want to correct
Posted Using LeoFinance Beta
👍👍👍👍