A Skeptic's Guide To Technical Analysis - Moving Averages

I made a general introduction to technical analysis in my previous article. Today I will write about moving averages.
The moving average is obtained by calculating the average of the prices that have occurred over a certain period using a sliding window. If we want to get the ten-day moving average of the price, we first calculate the average price of the last ten days. We again compute the average of the previous ten days the next day. In this new calculation, the new day's data is included in the analysis, and the data from eleven days ago is excluded. The next day we repeat the same process, and it goes on. A graph similar to the one below appears. The blue line on the chart shows the last 10-day moving average of the Hive price.
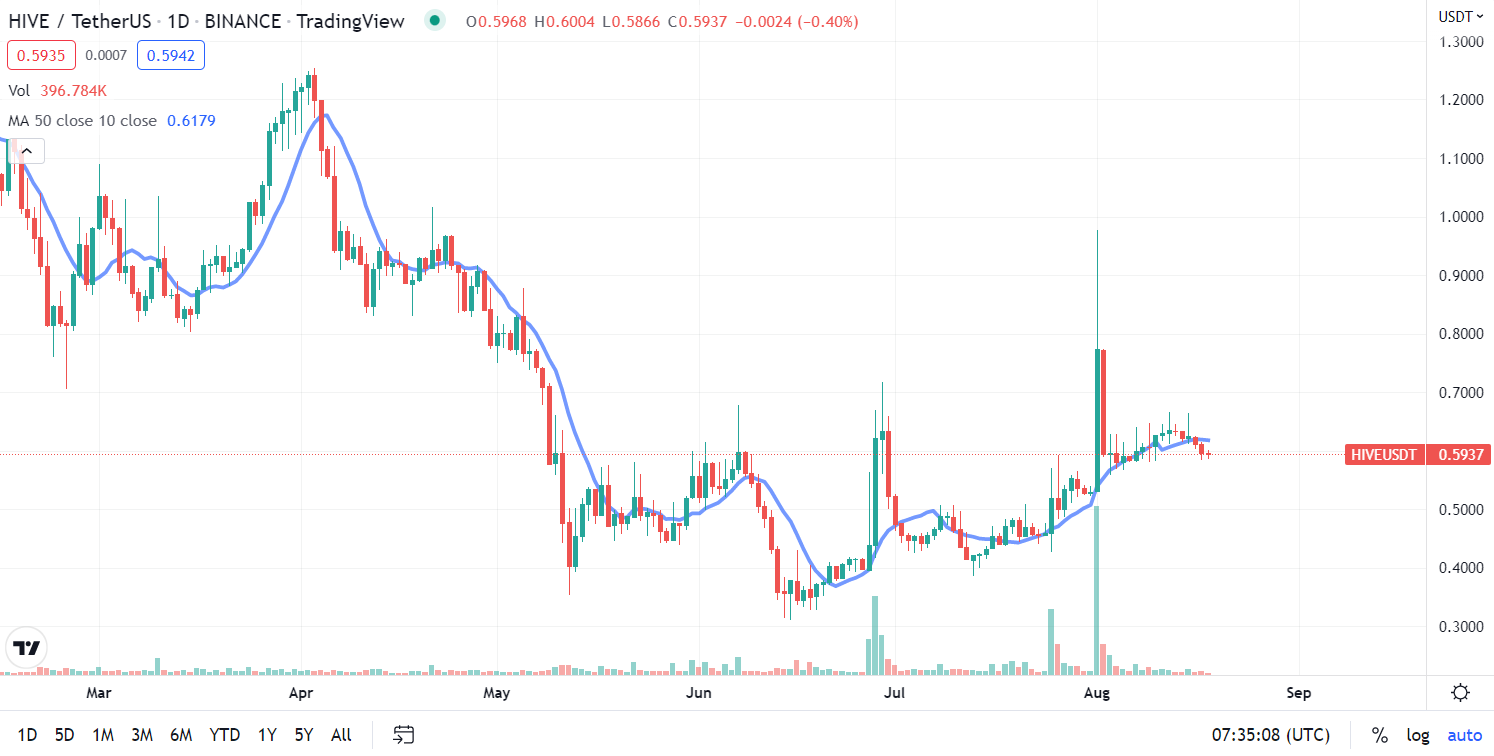
The current price above the moving average is a positive sign for the future. The current price below the moving average indicates that the price may decrease in the future.
Simple Moving Average Vs. Exponential Moving Average
There are two main types of moving averages, the simple moving average (SMA) and the exponential moving average (EMA). In the exponential moving average, the last days are included in the calculation more heavily.
One of the questions I asked myself about moving averages was which of the SMA and EMA is more critical. Different opinion leaders have different views on this issue.
Historical data can guide us in choosing between SMA and EMA. My recent observations in the crypto market have shown that the SMA is more important. By the way, there is no obstacle for us to use both together.
Selecting The Right Moving Average
Technical analysis allows us to write the story we want about a financial asset. When we look at Hive's technical indicators on Tradingview, we encounter moving averages that indicate both buying and selling.
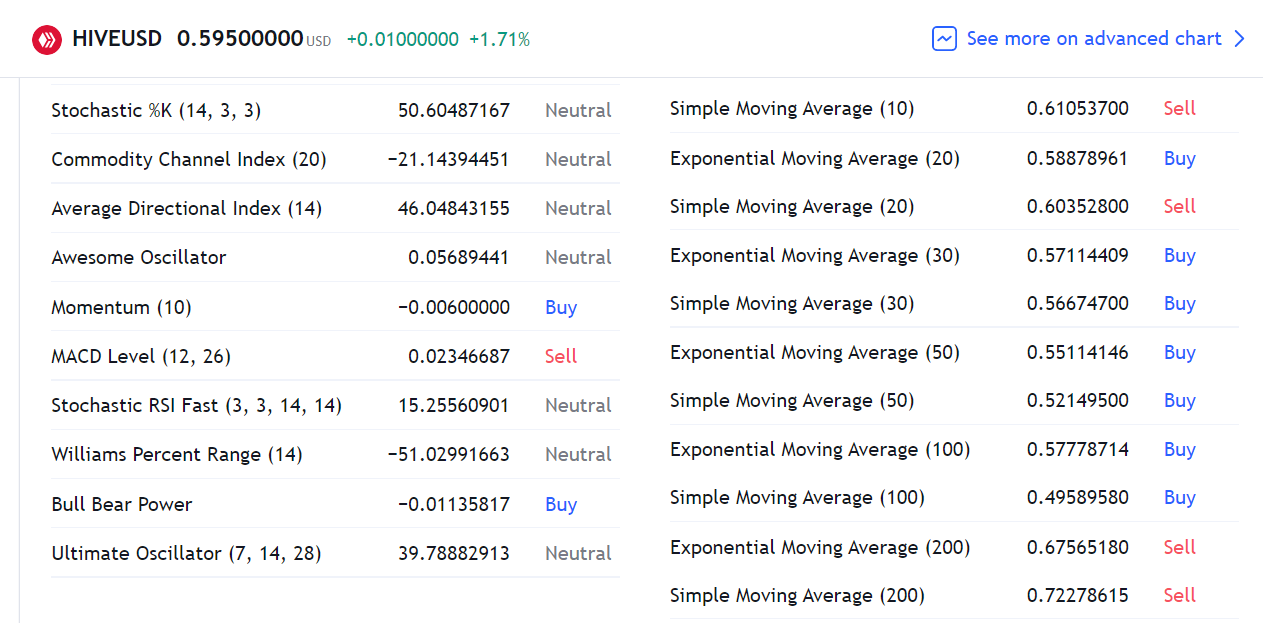
The question comes to our minds, which of these moving averages is more critical? I stated above that I prefer SMA to EMA. I think the essential time window is 200 days. Because the 200-day moving averages show the direction of the primary trend. If the Hive price permanently surpasses the 200-day simple average, we can conclude that the bear market for the Hive is over.
Selecting The Right Time Frame
By default, technical analysis is executed on daily charts. The moving averages in the chart above were also from the daily chart.
However, it is possible to use different graphs from 1 minute to 1 month in technical analysis. Day traders use charts arranged according to timeframes, such as 15 minutes, 30 minutes, or 1 hour. Traders like me who change their positions every few months use 4-hour or daily charts. Below we see the 200-period MA of the Hive on the 4-hour chart. The Hive price has been above the 4-hour MA since July 15.
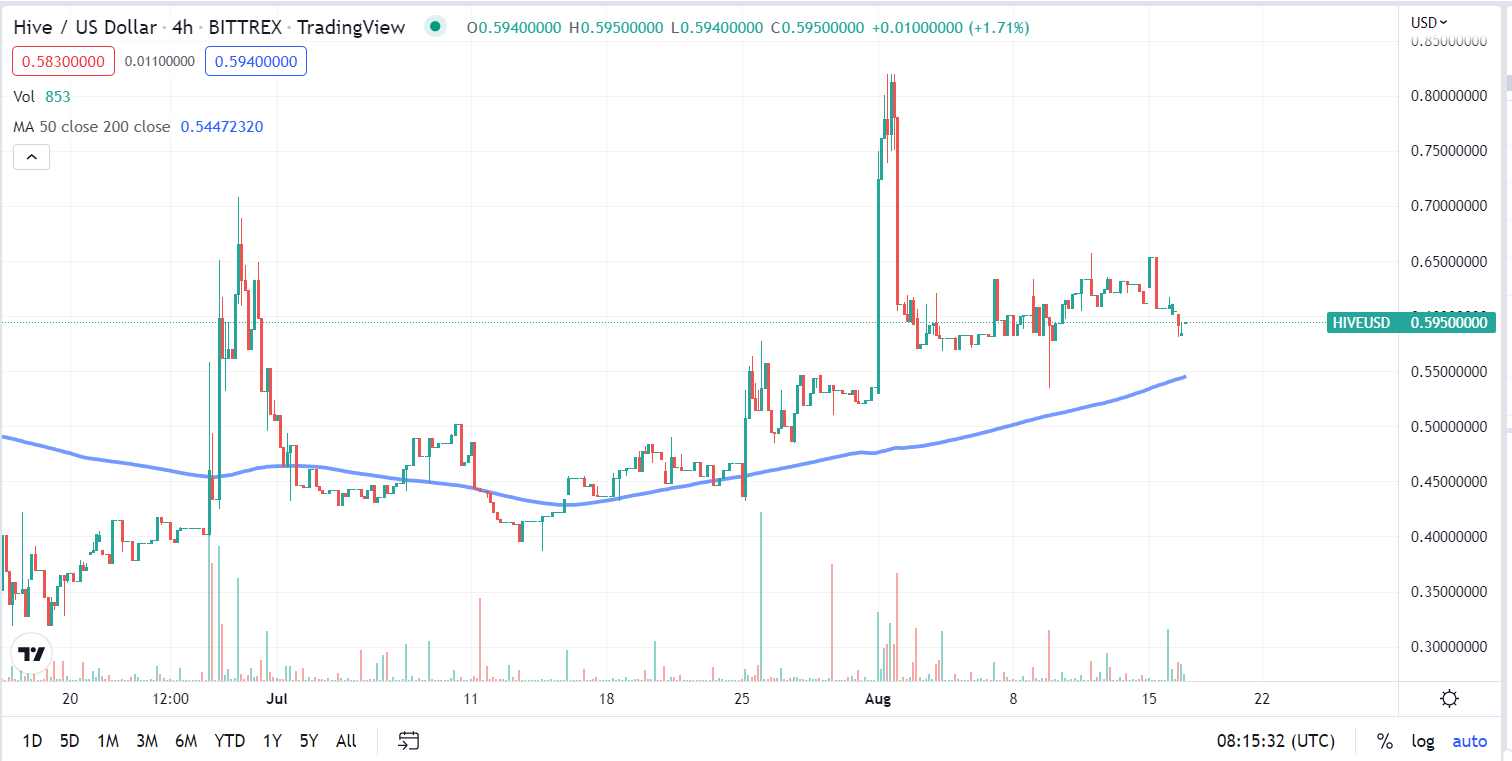
On the daily chart, the Hive price has not yet caught the 200-day moving average.
On the other hand, the 200-week simple average is also highly regarded by traders. Since the 200-week simple average covers four years, it gives an idea about the long-term fate of a financial asset. For example, in recent months, the Bitcoin price has fallen below the 200-week average for a few weeks, increasing anxiety. Because in the bear markets of 2015 and 2019, the price of Bitcoin found support from the 200-week average.
Red Cross & Golden Cross
We can calculate the moving average for 10, 20, 30, 50, 100, and 200 days. When a short-term moving average crosses a long-term moving average, it is called a golden cross. In the opposite case, the formation is called the Red Cross.
So which of the golden cross and red cross is more important? The intersection of the 50-day moving average and the 200-day moving average reveals the most critical golden crosses and red crosses. The chart below shows Red Cross for the Hive formed on February 27, 2022. At that time, the Hive price was $1.03.
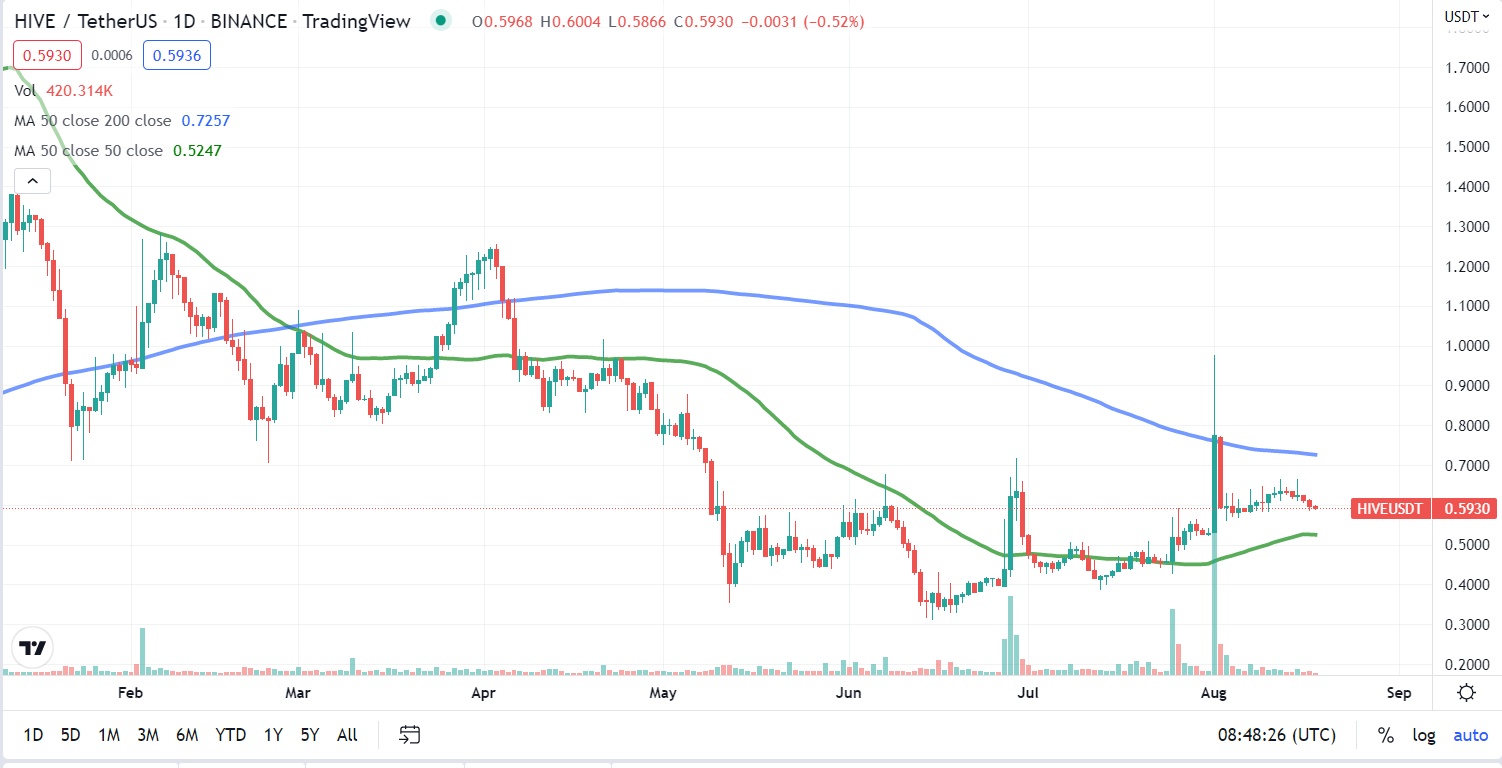
The chart also shows that we should wait 1-2 months for a possible golden cross.
Conclusion
Moving averages are essential analysis tools for detecting trends. In some cases, they can also act as support or resistance points.
My backtests have shown that strategies based on moving averages are unsuccessful when used alone. Combining the insights from moving averages with other information would be appropriate.
Thank you for reading.
Posted Using LeoFinance Beta
https://twitter.com/taskmaster4450/status/1560275747587391490
The rewards earned on this comment will go directly to the people( @taskmaster4450le ) sharing the post on Twitter as long as they are registered with @poshtoken. Sign up at https://hiveposh.com.