Bears Are Back In Town

The speeches of Jerome Powell continue to shape the market. Powell's speech on March 7 about the rigidity in inflation strengthened the possibility of a 50 basis point rate hike. The FED Rate Monitor Tool published on Investing.com shows that the probability of a 50 basis point increase on March 22 is 78%. That rate was around 20 percent last week.
The bears greeted Powell's speech enthusiastically, but a recent statement by Powell yesterday overshadowed that enthusiasm. Powell stated they have not decided on interest rate hikes in the US Congress. Because excessive rate hikes may threaten employment in the United States. The speech delivered by Senator Elizabeth Warren at the senate session on Tuesday was striking. In her speech, Warren scolded Powell for possible job loss, and Powell could not answer Elizabeth Warren's questions convincingly. I had fun while listening to the speech.
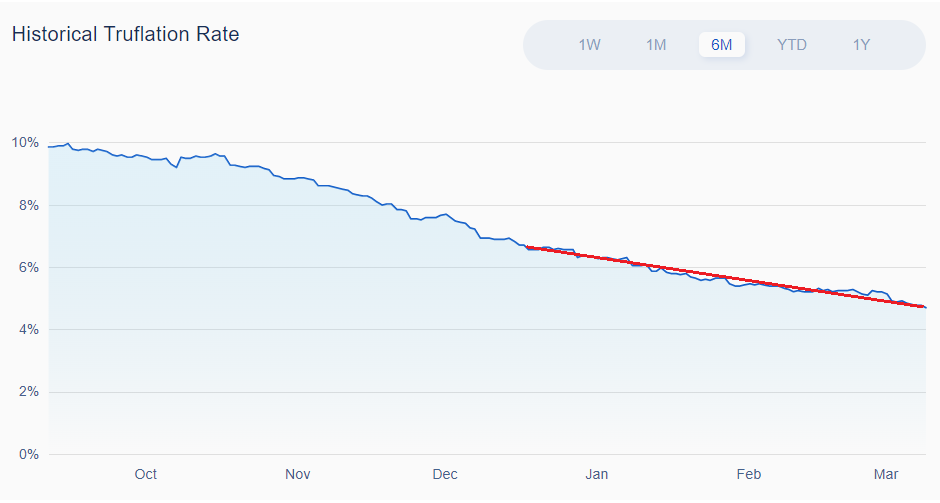
Uncertainty about the Fed's rate hikes continues. How will the inflation in February affect the interest rate decision? US CPI inflation was 6.4% at the end of January. This data, which indicates a decrease of only 0.1% compared to the previous month, was interpreted as rigidity in inflation. Truflation site data shows that this rigidity continued in February. The trading Economics website predicts that CPI inflation will be 6.3% at the end of February.
On the other hand, the daily data of Truflation also show a rapid decline in inflation in March. Long story short, we need more clarity on interest rate hikes. In such periods of indecision, technical levels become essential.
Nasdaq 100 Technical Analysis
The 11,9k-12k band and the 200-day SMA are significant for the Nasdaq 100 index. As we can see in the chart below, the 11,9k-12k band has acted as support and resistance several times. And when this price zone is crossed either up or down, price movements accelerate. The Nasdaq 100 index has been dancing around this region since May.
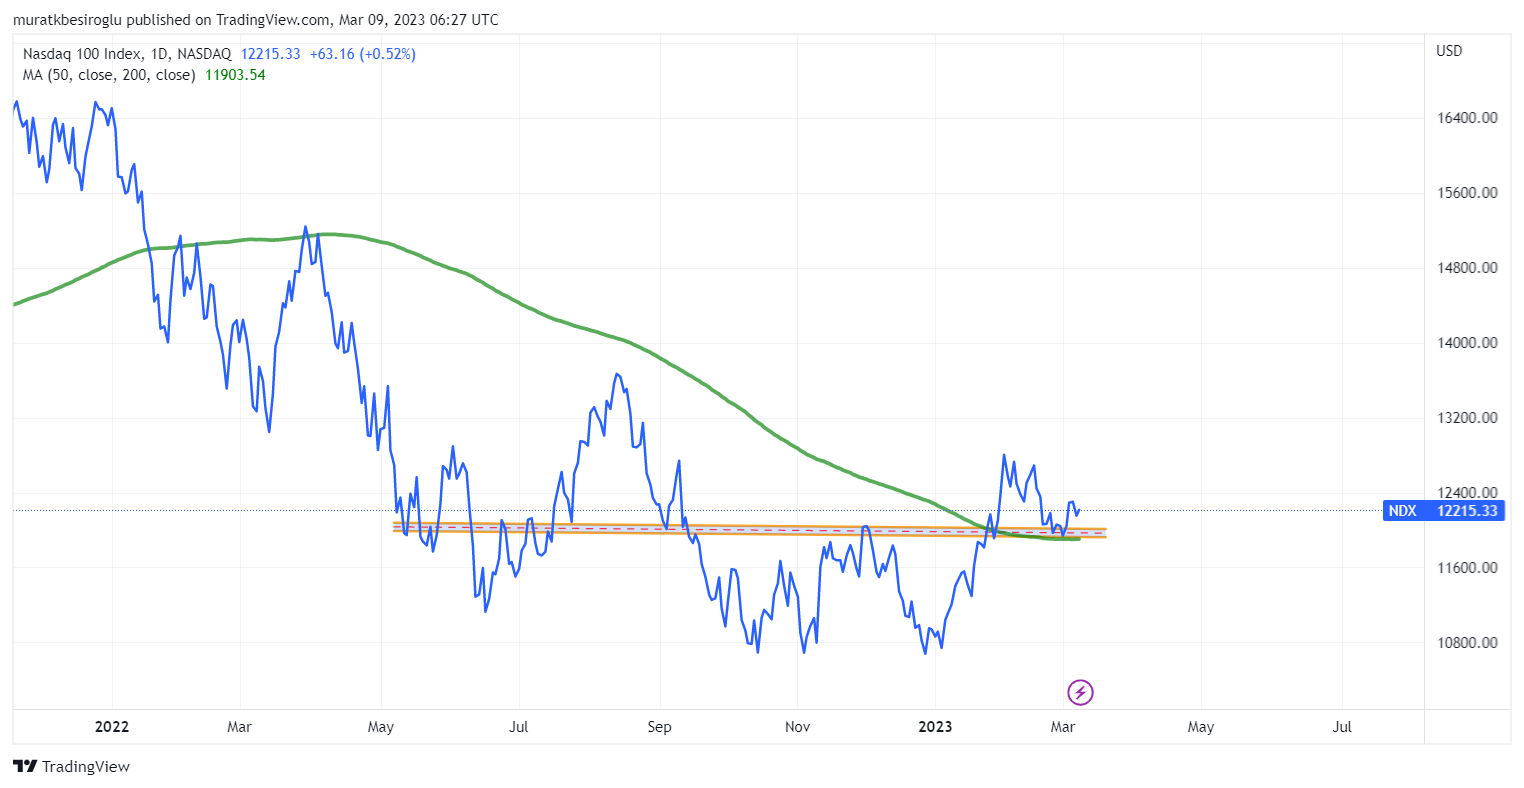
By the end of January, the index had exceeded 12k and had risen to 12.8k. As of March 1, the index retreated to the band and rose again with support from this range. Currently, the Nasdaq 100 is hovering above this critical zone.
A robust upward movement started when the 200-day simple average, which I showed in green on the chart, merged with the band level. Currently, the 200-day SMA forms the lower limit of the critical band. The Nasdaq crossed the 200-day simple average, retraced a month later to test this level, and has managed to stay above it for the past few days. Technically speaking, an uptrend is more likely than a downtrend.
Bitcoin Technical Analysis
Bitcoin and Nasdaq charts are very similar. The critical price zone for Bitcoin is the 21k-21.5k USD band. Bitcoin price has hovered around this zone for the past eight months as bears constantly write new disaster scenarios. The movements gained speed when the 21k-21.5k band was passed down or up.
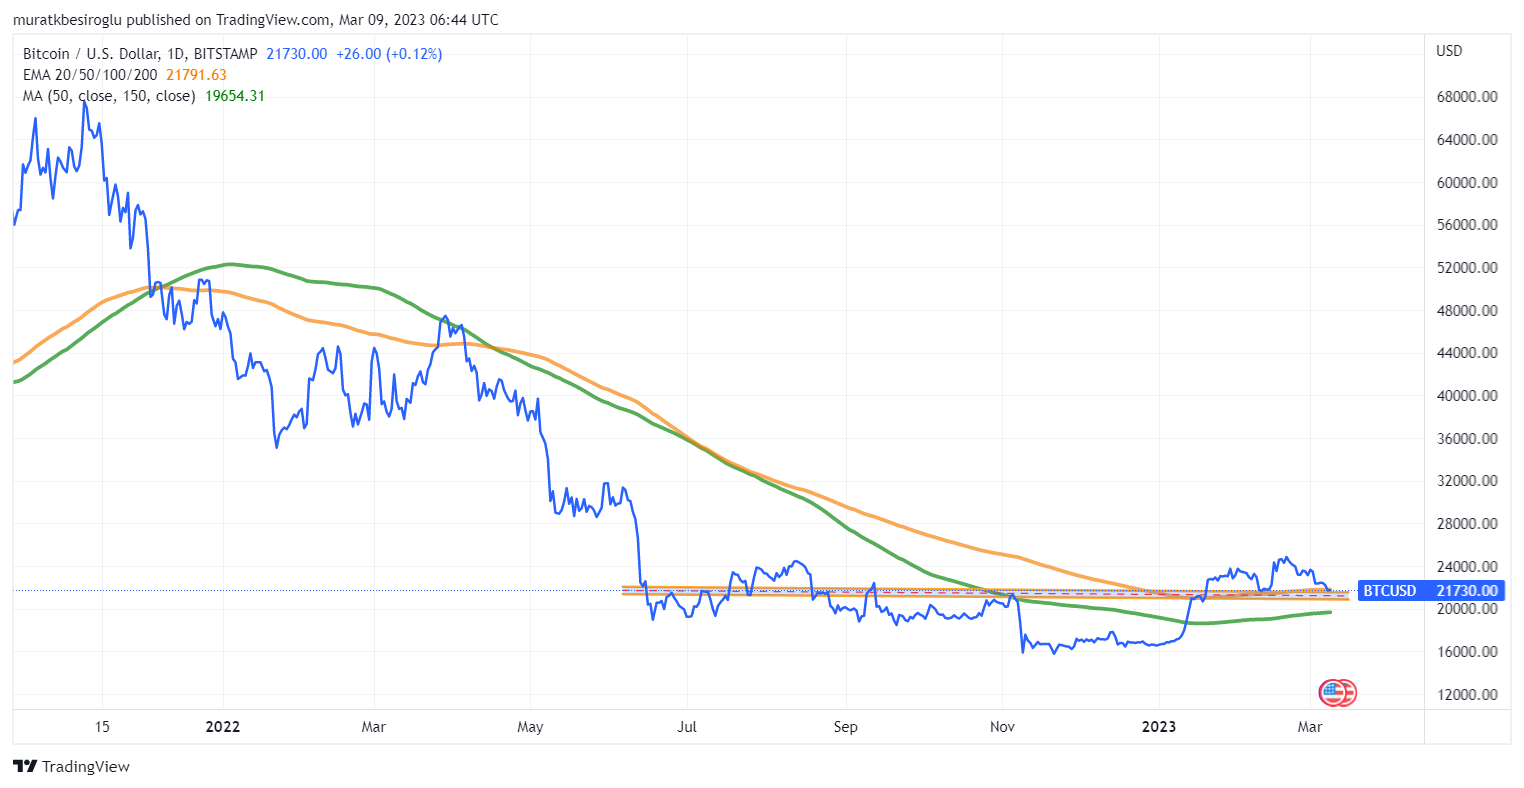
The orange line on the chart shows the 200-day EMA, and the green line shows the 200-day MA. I have included both in the chart as both have acted as support/resistance in the past months. Currently, the Bitcoin price is above both. Therefore, an increase is more likely than a decrease.
Conclusion
There is no need to worry as long as 11.9k in Nasdaq and 21k in Bitcoin is not crossed downward. Temporary fluctuations do not change the fact that inflation in the USA has been steadily declining. Although it has not been reflected in official data, inflation in the USA has dropped below five percent. (Source: Truflation.com)
It means that interest rates will exceed the inflation rate after the March meeting of the FED. The FED will think twice about its increases in a positive real interest rate environment.
Since last summer, we have been trying to predict whether the bear market will deepen further. The developments so far have not justified either the bears or the bulls. But the time of bulls like me will surely come. :)
Thank you for reading.
Cover Image Source: Midjourney App
Posted Using LeoFinance Beta
Yes the market seem to be back in bearish trend and most of the Crypto coins are in red. Even the hive price has gone down. I expect that this year 2013 is going to be overall bearish like this however there can be few opportunities when we can see some price jumps.
I expect 2023 to be a neutral year for crypto.
Bad news always comes in a horde... A heavy bear market is a perfect moment to drop as many "bombs" as possible on crypto... Jerome Powell's speech was just one event, and if you add SilverGate, SEC attacks on many "crypto companies", and other news, you get a "perfect storm"... The problem is that most of this "news" are pre-fabricated to spread the FUD and this will slow down crypto, but I doubt it will stop it...
We have survived much worse things in the past... 😃
I have picked this post on behalf of the @OurPick project which will be highlighted in the next post!
Pain that doesn't kill makes us stronger :)
Brilliant input from you
!PIZZA
PIZZA Holders sent $PIZZA tips in this post's comments:
@tin.aung.soe(4/10) tipped @muratkbesiroglu (x1)
You can now send $PIZZA tips in Discord via tip.cc!
Halving in 2024, so no worry...
We have to hold tight.