Is The Crypto Bear Market Finally Over?

I had my most nervous day in the crypto market when USDC lost its peg last Saturday. That day, Bitcoin held on to the $20k resistance, and the market's direction changed. On Monday morning, we learned that the American financial authorities would pay all deposits of Silicon Valley Bank (SVB). Thus, Circle, which issued USDC, could receive its remaining $3 billion in deposits from SVB. USDC rose to the required level of $ 1, and cryptocurrencies rallied. We are discussing that the bear market may have ended a week after that catastrophic event.
We've been getting signs since the beginning of the year that the bear market might end. Dow Jones, S&P, Ethereum, Bitcoin, and Nasdaq 100 have climbed above their 200-day simple averages and have hovered above them for two months. FED rate hikes have been the primary concern since then. Things changed rapidly last weekend when three banks in the U.S. could not pay their depositors' money. Analysts of institutions such as Goldman Sachs and Moody's predicted that the FED might not raise interest rates on March 21. A Namura analyst went one step further and stated that the FED could cut interest rates on March 21. The calculations made by the CME Group on the futures market pricing show that the FED will increase the interest rates by 25 basis points with an 87% probability. The probability that the Fed will not raise interest rates is 13%. The Fed will undoubtedly consider the concerns of depositors. Dovish rhetoric accompanying a 25 basis point increase is the most likely scenario.
Until last week, it was a reasonable choice for the FED to stay on the safe side regarding inflation by raising interest rates aggressively. Failed banks became a clear indication of the damage caused by high-interest rates on the financial system. Meanwhile, February's inflation data may encourage the FED to stop interest rate hikes. Because in February, CPI inflation was 6%, in line with market expectations. This data indicated a decrease of 0.4% compared to the previous month. Producer prices announced two days ago were even more encouraging. In February, producer prices in the USA decreased by 0.1%, and annual inflation fell to 4.6%. So, how is inflation in March? Truflation data shows annual inflation decreased by 0.9% in the first 16 days of the month. The base effect of inflation of the period last year also contributed to the formation of this data. Analysts see an encouraging outlook on inflation. The U.S. two-year bond yield has fallen by 93 basis points in the last ten days.
How have the developments briefly summarized above affected the crypto market? Do the leading technical analysis indicators also support the thesis that the bear market is over? Due to the high correlation between crypto assets, I will only analyze Bitcoin price. I want to start with the 200-day SMA.
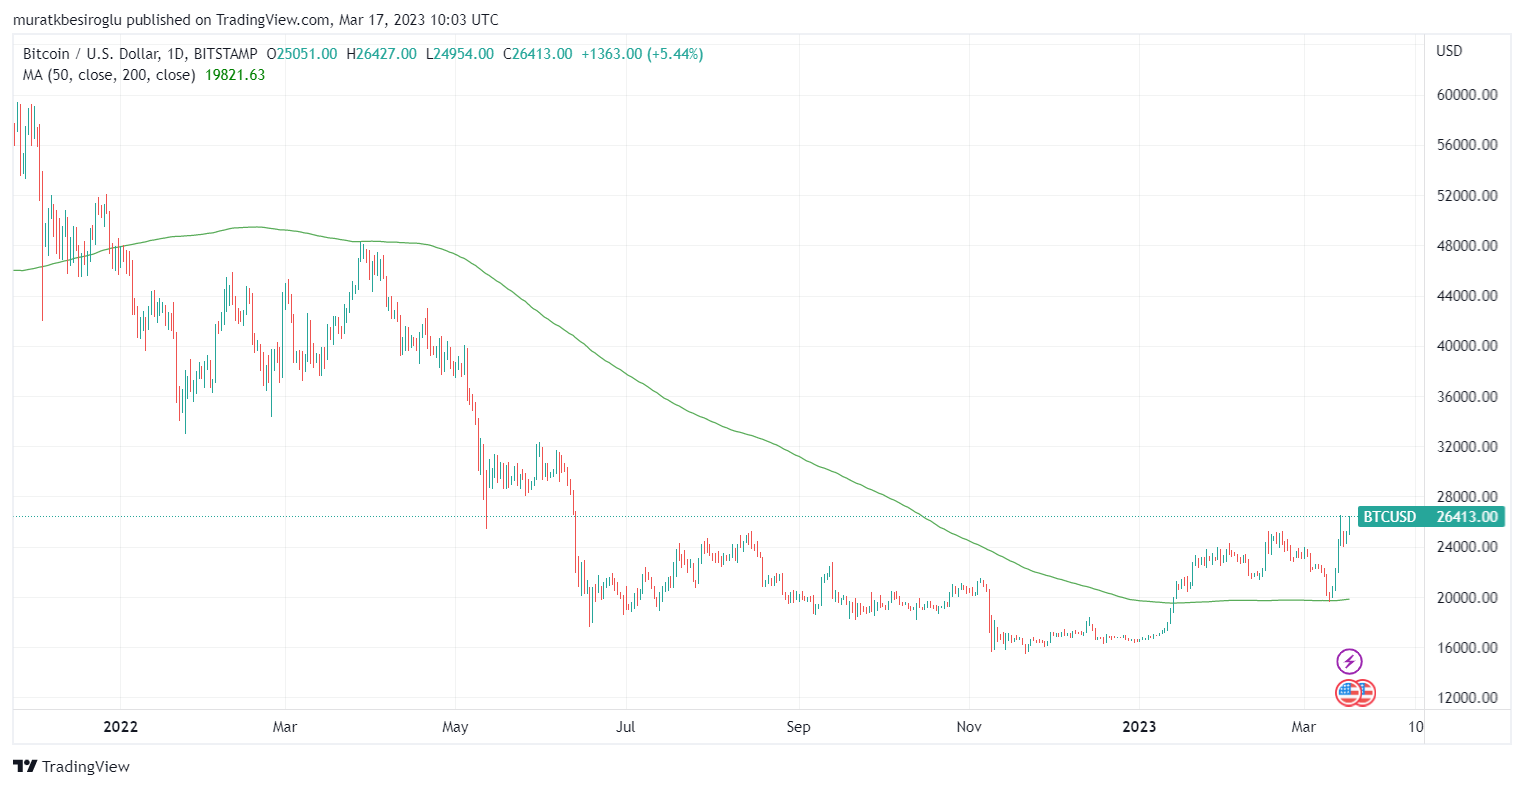
The chart shows that the Bitcoin price fell below its 200-day simple average in the first days of last year. In March, it tried to surpass the said average and failed. Bitcoin price crossed the 200-day average on January 15 of this year. On the day USDC lost its peg, it assumed the function of resistance, and a rapid rise was realized. In the meantime, the price has passed 25k USD, which has served as a resistance twice before. The 25k level was the last stronghold of the bears. Now that castle has been conquered by the bulls.
One thesis of those who argue that the bear market is still ongoing is that the price of Bitcoin has yet to cross the 200-week average. Two hundred weeks corresponds to about four years, and the price above the 200-week average indicates an upward trend.
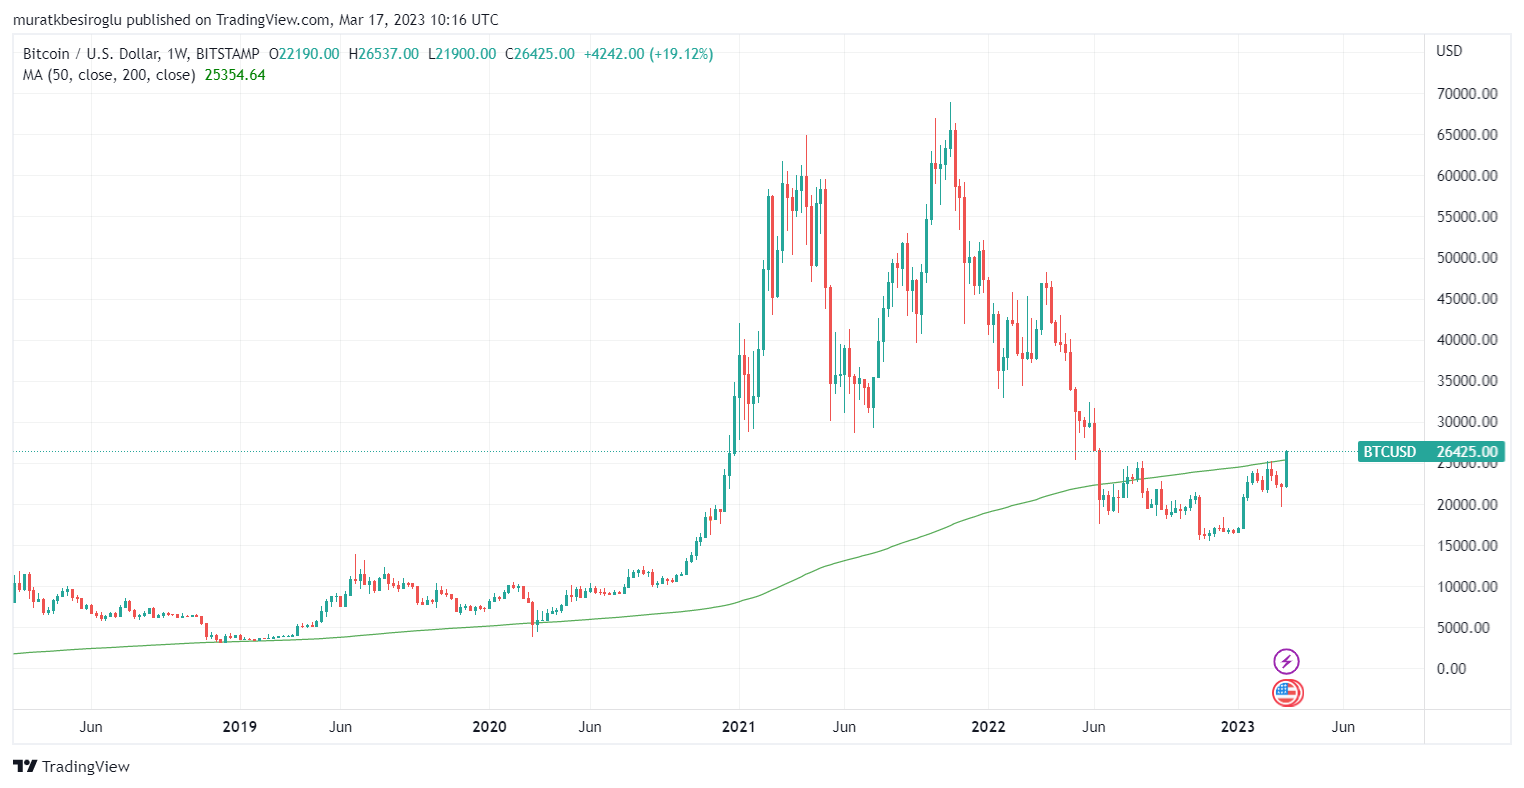
The chart shows that the 200-week simple average worked as support in the previous bear market. In the bear season of 2022, the price of Bitcoin fell below the 200-week average. This week, we see the price rise above the line for the first time. A close above the line has yet to occur. We have to wait two more days to see the end of the week.
Another important indicator that shows the market's general direction is the weekly relative strength index(RSI). What kind of a view does the weekly RSI offer us?
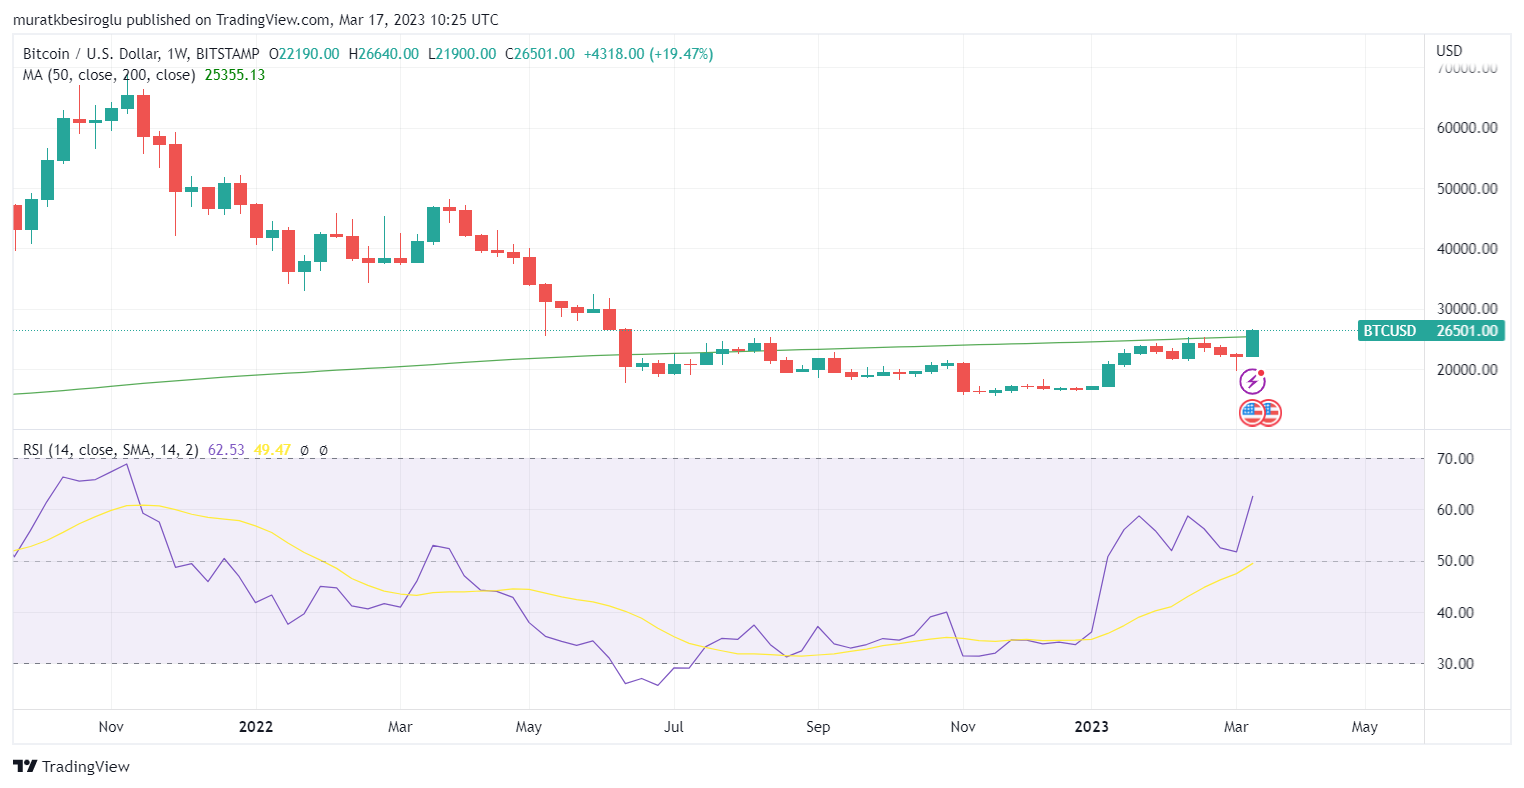
A weekly RSI above 50 indicates an uptrend. The chart shows that the weekly RSI is below 50 throughout 2022. Since 2023, it has exceeded 50 per week and exceeded 50 for about two months. Other data showing the end of the bear market...
What Is Next?
Although the bear market is over, we cannot say we have entered the bull market yet because it will take time for investors to forget the losses of last year and gain courage again. The market may follow a volatile course in the next few months. On the other hand, the ground is suitable for purchasing.
Conclusion
2022 has been a tough year for crypto investors. In 2023, we witnessed a rapid rise in January. Afterward, a fluctuating course occurred in the market until this week. If we don't encounter a black swan event, I think the primary trend is upward from now on.
Thank you for reading.
P.S. I am not an investment advisor. Please do your own research.
Image Source: Midjourney App
Posted Using LeoFinance Beta
definitive yes! :)
https://peakd.com/hive-167922/@tobetada/crypto-analysis-or-bear-market-ends-and-macro-outlook
@tipu curate
Upvoted 👌 (Mana: 27/47) Liquid rewards.
This is the main issue, it seems we're in a sort of waiting room, in-between the and bear market and we cannot seem to take off yet, because of the events of last year. I think the SEC and some events that has created FUD has also contributed to where we are, the flunctuation in price seem to negate a strong rally. Hopefully the coming months will be better.
Posted Using LeoFinance Beta
The bull is definitely on the horizon and we just need to take a few more bold steps to arrive at it. I think one of the reasons why people are hesitant to accept that the bull is around the corner is because they're still holding on the past.
We're not in a bull market but I think the trend of new lows has stopped.
Cryptocurrency enthusiasts have been eagerly waiting for signs of the bear market to come to an end. While the market has been showing some positive signs lately, it's hard to tell for sure. However, there are ways to analyze market trends and make educated predictions. One of these is by using technical indicators, such as the stochastic oscillator. If you're unfamiliar with this tool, check out this guide on using the stochastic oscillator and the best settings to use. It could help you better understand the current state of the market: https://www.litefinance.org/blog/for-beginners/best-technical-indicators/stochastic-oscillator/