My Favorite Crypto Data Sources

American psychology professor Abraham Herald Maslow once said, "if you only have a hammer, you tend to see every problem as a nail." As I have been dealing with analytics throughout my banking career, I approach the crypto market with a data-driven approach.
With digitalization, data-based decision-making comes to the fore. So the hammer in my hand may have turned into a Swiss army knife.
In this article, I will talk about significant crypto data sources, some of which are well-known, and how I use them.
Coingecko and Coinmarketcap
I cannot give up on both of these sites, which have similar features, because both have different advantages. I use Coinecko to track the value of my portfolio. I like that it shows hourly price changes as well as daily and weekly price changes. Because I think hourly price changes mainly demonstrate the direction of the market. If the hourly change throughout the day, even with slight differences, points in a particular direction, I conclude that the trend is vital in the market.
We can customize Coinmarketcap's price table. Thus, I can add to the table, for example, the price change of cryptocurrencies since the beginning of the year.
Both sites show the categories of cryptocurrencies via tabler. Using these tabs, we can list cryptocurrencies with similar features.
Another feature I discovered recently is the trending coins that appear when I click on the search box. This feature, which is valid for both sites, helps me understand the popular coins of that day.
I like to use the historical snapshots feature of Coinmarketcap. In this way, for example, I can see which coins were popular two years ago.
Messari.io
I have used Messari.io for three different purposes so far. The first of these purposes was to see under which categories various sites classified certain coins. For example, Messari classifies Hive under the category of "Content Creation and Distribution." He also considers Hive as one of his web3 coins.
By the way, I was intrigued by the fact that Coinmarketcap sees Hive as a scaling solution. Hive is still eighth on the list, whereas Polygon is first.
Another feature of Messari that I like is the inclusion of risk metrics in the data set. Sharpe Ratio, calculated by considering price volatility and performance, is a metric I often use in my investment decisions. For example, Hive is among the few coins with a positive monthly, quarterly, and annual Sharpe Ratio. You can access the risk metrics of significant currencies at this link.
Coins with high supply are under more significant selling pressure than others. The most practical way to track the amount of supply is to look at the inflation rates of the coins. We can also reach the inflation rates of currencies through Messari. I think you can access this treasured information here.
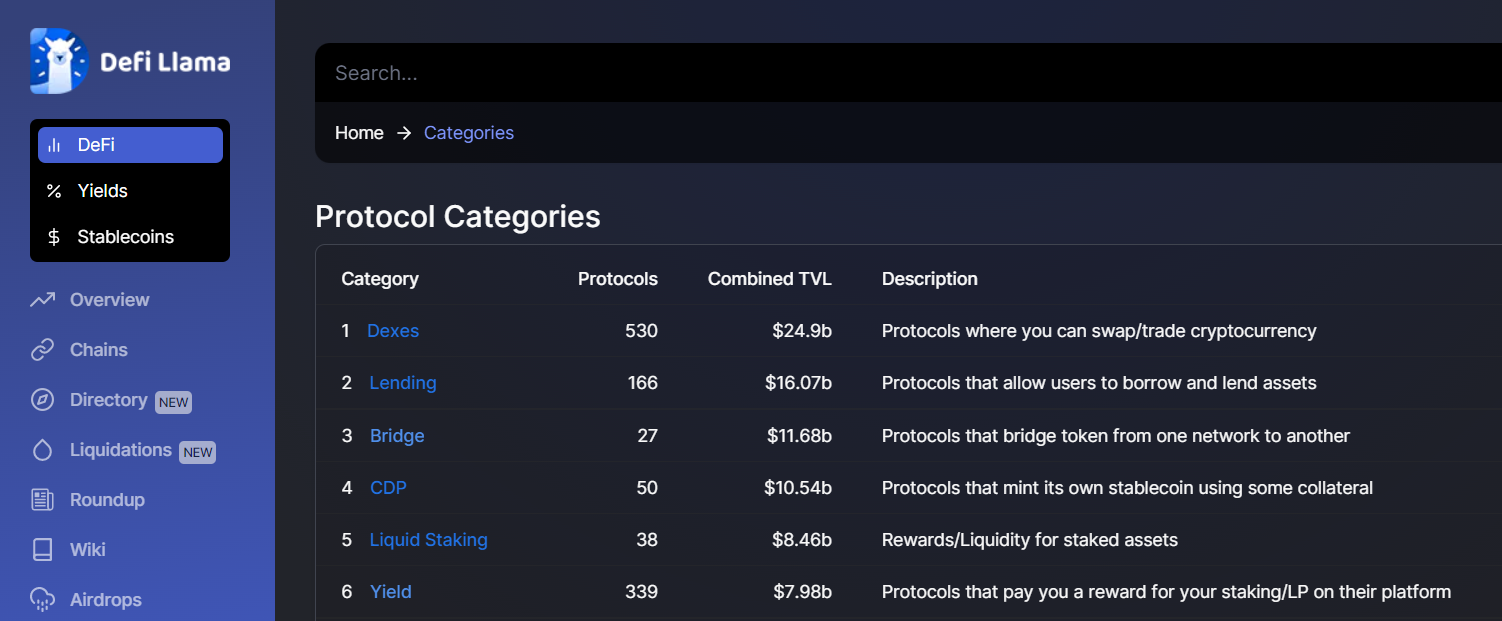
Defillama
There can sometimes be a great distance between the promises of coins and reality. DEFI statistics show how smart contract cryptos and DEFI applications are used daily.
We can access the total value locked information of networks and Dapps through defilement. Thus, it is possible to follow the trends in the field of DEFI.
I frequently review the protocol categories in the DEFI area of Defillama. Because these categories show the level of sophistication that the crypto world has reached in finance.
I also use Defillama to guide my DEFI investments.
Data on HBD and Beeswap liquidity pools are not yet reported on Defillama. In addition, Polycub and Cubdefi are not among the yield farming applications. Reporting DEFI data can contribute significantly to Hive's promotion of Leo Finance.
Dappradar
Dappradar statistics show the usage of blockchains and decentralized applications. It is also essential to follow the user numbers and transaction volumes of dapps to evaluate crypto adoption. However, it is difficult to claim that the Dappradar data are complete. I'm guessing games like dCity, and Rising Star have a much higher player count than reported.
We can see the number of traders and sales of NFT collections on Dappradar. It is also possible to track trader and sales numbers for marketplaces.
Airdrop notifications are regularly posted on Dappradar. In the past, Splintertlands also organized an airdrop that it announced on Dappradar.
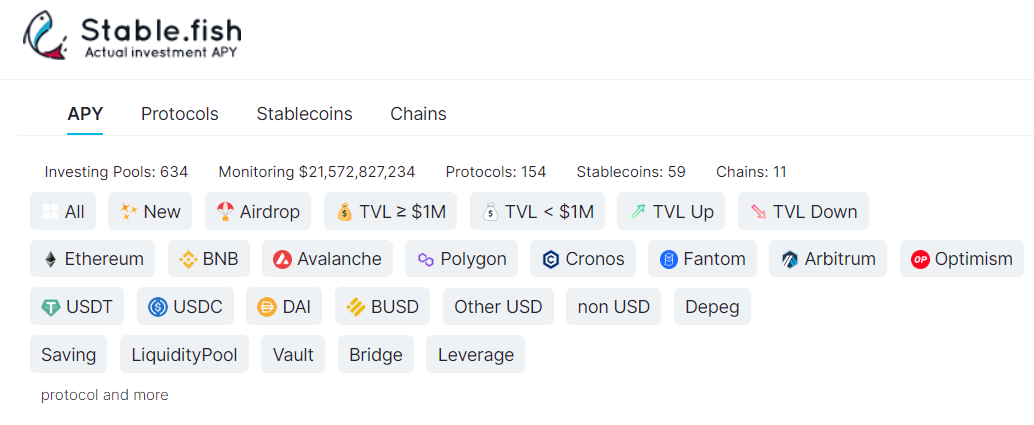
Stable.fish
Finally, it's time for a relatively little-known site. Stable.fish shows returns on stablecoins and associated gas fees. The site displays the highest-yielding stablecoins and related applications at the top in the default setting. Without detailed research, investing in a stablecoin that provides high returns would not be right. A high TVL, for example, can be considered a positive indicator.
There may be some who think why we need other stablecoins when there is HBD. The Luna case showed us how wrong it is to put all your eggs in one basket. Although we trust HBD, I think that portfolio diversification is necessary.
One of the site features that I like is that we can choose a stablecoin we want to invest in and see the investment alternatives it is included in. Coindex could also be an option for tracking DEFI returns.
Cryptoslam.io
Cryptoslam, which I use to monitor the NFT market, also contains information on Fan tokens. NFT sales volumes based on collections are displayed on the site on a 24-hour, 7-day, and monthly.
Another statistic that caught my attention on the site is the daily NFT sales volumes based on blockchain. The site shows that the top 5 NFT networks are Ethereum, Solana, Immutable X, Flow, and BNB. No Hive, although Wax is on the list. It means that the sales on @Splinterlands are not reflected on the site. I wish the site showed both collections and transaction volume because these are the sites that investors frequently visit.
Conclusion
Leveraging data on crypto investment makes it possible to go beyond the artificial images created by media. Though their ICO was made years ago, dozens of projects still do not benefit users significantly. Some of these have more than ten times the market capitalization of Hive.
On the other hand, data-driven decision-making has its limits. Macroeconomic developments may occur that are not indicated by any data. In addition, we can not track distractive innovations through data.
In any case, conscious investors will not hesitate to benefit from the data as blockchains provide the necessary transparency.
Thank you for reading.
Posted Using LeoFinance Beta
I'm just curious, when looking at historical snapshots, do you ever go beyond two years?
Yes, I do. I made my first crypto investment in 2018. So I looked at the top cryptos of that time and how they are doing now.
Posted Using LeoFinance Beta
https://twitter.com/Allen_Taylor/status/1564552992115888130
The rewards earned on this comment will go directly to the people( @allentaylor ) sharing the post on Twitter as long as they are registered with @poshtoken. Sign up at https://hiveposh.com.
It very nice to get data and information from reliable sources it goes a long way in any crypto investment some apps have the added advantage of been not just data driven but also having informations on how the market looks like from the outside environment of the crypto market