Strengths And Limitations of Technical Analysis

I have always been skeptical of technical analysis. This skepticism hasn't stopped me from being a passionate student of technical analysis. I maintain my critical point of view today. On the other hand, I know that the days and nights I set aside for this occupation were not wasted. What I learned about technical analysis helped me stay afloat in this bear market.
The latest price movements in crypto have also revealed the limitations of technical analysis. Macroeconomic developments in certain periods make technical analysis almost meaningless. Also, after bull markets, when the party is over and the music is down, the quality of the assets owned becomes more important.
One of the factors that make the application of technical analysis difficult is that there are different schools within this discipline. We can find a lot of data to confirm or reject a trading decision.
Volume, for example, is very important for many traders. The fact that the price movements were accompanied by high volume is seen as a strong sign of the continuity of the movement.
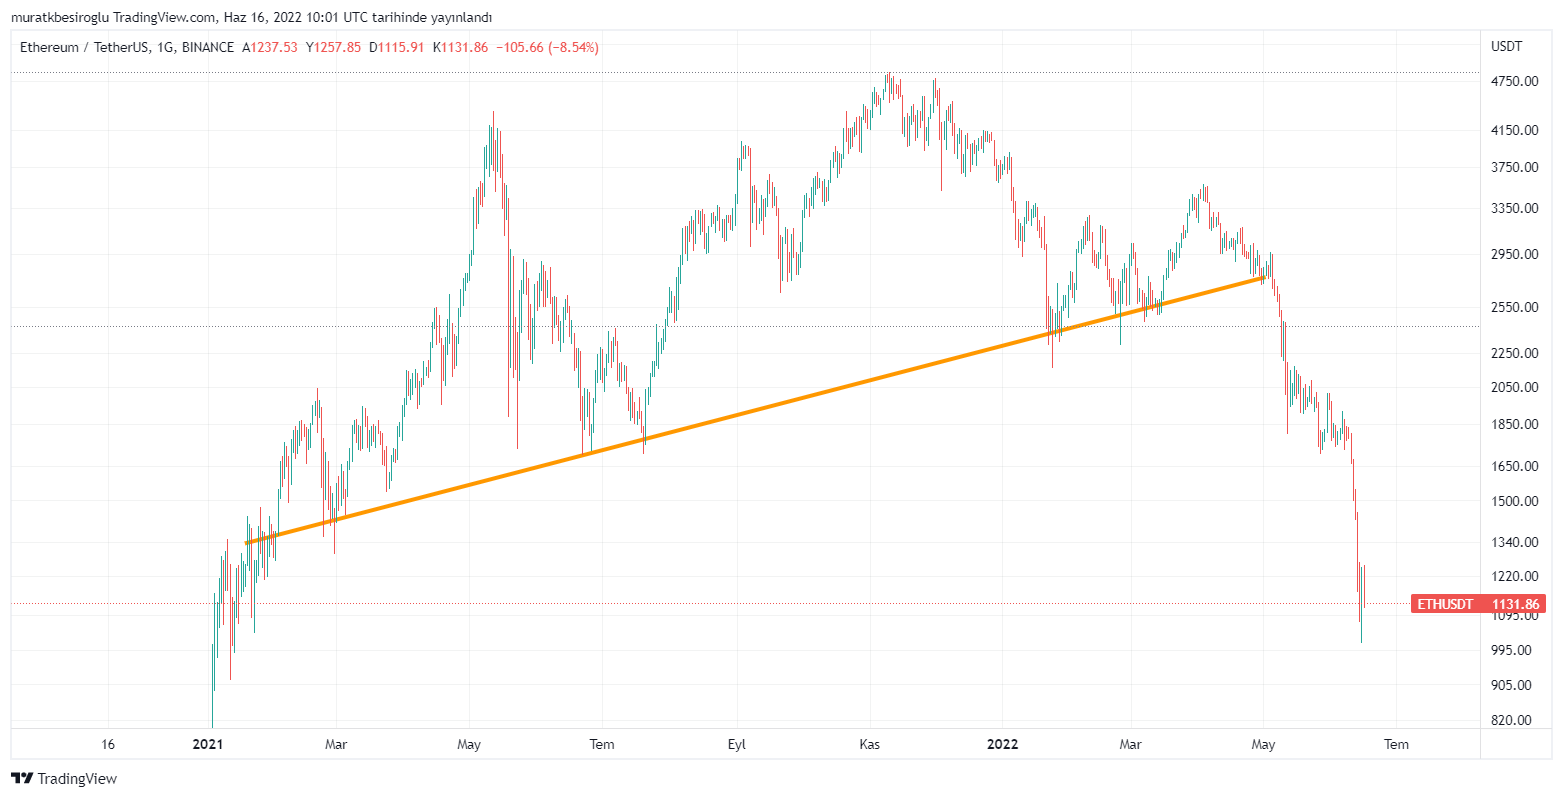
Chart patterns analysis is one of the most commonly used technical analysis methods. It starts from the assumption that certain patterns that occur on price charts have special meanings. For example, if the price has returned from a certain level three times, it is concluded that that level cannot be exceeded in the short term. The shoulder-head-shoulder is another pattern that signals trend reversals. Formations such as double top or double bottom are not reliable enough. Trend lines drawn on the chart can also give clues about the direction of the market in certain situations. You can see a trend break in the following Ethereum chart that occurred at the beginning of May 2022.
Identifying support and resistance zones is another popular method in technical analysis. This method becomes more powerful when used with chart pattern analysis.
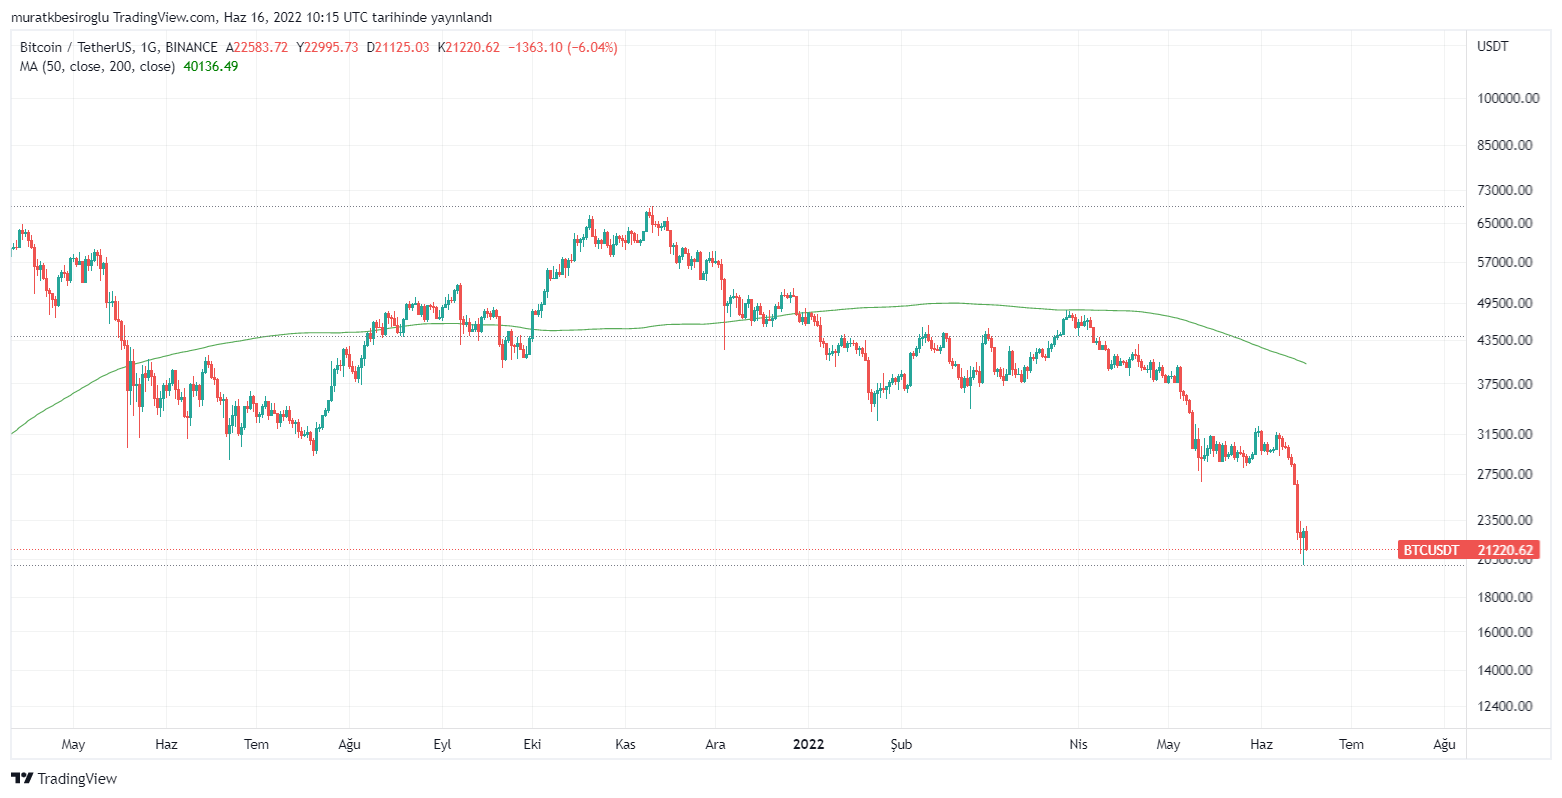
One of the main tools of technical analysis is moving averages. 20, 50, 100, and 200-day moving averages are used more often than others. There are two types of moving averages, simple and exponential. The exponential moving average gives more weight to recent price movements. The simple moving average (SMA) seems to be more important in the crypto market. A move above a moving average is perceived as a positive sign. In the daily chart below, we see that the BTC price entered a rapid downtrend after returning from the 200-day SMA at the end of April.
It is also possible to use different methods such as candlestick patterns, momentum indicators, divergences, and Fibonacci levels, each of which is a subject of an article. Moreover, using the graphics hourly, 4-hourly, daily, or weekly changes the results. Panoramic View of Technical Analysis article I wrote before can offer a more holistic view.
Conclusion
In our age, we know that power comes from knowledge. Technical analysis is one of the important information sources we can refer to when it comes to investment. However, it is necessary to be cautious about price predictions based on technical analysis.
In certain periods, macroeconomic developments become decisive. High inflation forced central banks to raise interest rates. With the rising interest rates, the liquidity in the market is decreasing. As such, sales were seen in all risky assets. The sell-off on the crypto front had been more dramatic as it has been accompanied by the panic caused by Terra's collapse.
In addition to liquidity conditions, price movements in Bitcoin and Ethereum also affect the prices of other altcoins. It is necessary to interpret the technical indicators according to which market cycle we are in at that moment. Very strong arguments are needed for selling during a bull market. The same is true for buying during a bear market. During the range market, support and resistance points gain more importance.
On the other hand, coins in certain crypto categories rise together, especially during bull seasons. The utility of the asset to be purchased and the token economy affect the results to be achieved.
When macroeconomic developments, fundamental analysis, token economy, and technical analysis information are evaluated together, a holistic picture can be drawn. No matter how competent we are in using information, we still cannot predict the future clearly. That's why it's always good to be cautious.
Thank you for reading.
Posted Using LeoFinance Beta
Quite a valuable article...
I've never attended a technical analysis class nor read through any article on the topic, but this has been my pattern of trading of recent...
However, it's still a very much risky method considering the "short term" effects, as such, it's important to set stop loss. I usually stick to a 30 mins chart when trading this pattern...
Posted Using LeoFinance Beta
That's the point.
Posted using LeoFinance Mobile
I'm still heavily relying on Moving averages, trend lines, RSI and other indicators. However, the market is, often, directly affected by surprising FUD waves. Thus, I'm doubtful whether price follows the news or news follows the trend ^^
Posted Using LeoFinance Beta