BTC could touch 20K again in the short term
Hello Hivers,
This is my first post in this community and I would like to be able to share my analysis whenever possible, because trading is my passion.
So I am going to dare to show you my assessment about what could happen with Bitcoin in the next few days, but please note that this is not in any way an investment advice, but a mere market speculation.

After a dismal fall of 27.17% since November 6, the bitter taste of the current Bear Market in the crypto world has become more pronounced. Investors and traders, in general, see even closer the possibility that Bitcoin will not only fulfill a destiny many times announced of trading in this bloody period at 10,000 USD, but even touch the devastating figure of 3,000.
Naturally, the occurrence of any of these scenarios will be interpreted and assimilated according to one's perspective. Because let's say that for long-term investors and holders, this would not be too shocking as it would give them the excellent opportunity to accumulate more coins of the asset or other projects that, logically, will see dream prices. However, futures traders, with already committed positions, are likely to end up liquidated, and those who no longer have enough capital to buy the deep, will have to resign themselves to seeing their funds disappear, or in the best of cases, endure the pain of seeing their coffers more than depressed for who knows how long.
The current situation is certainly not favorable for Satoshi Nakamoto's invention or for other crypto currencies. One third of the world economy is expected to be in recession by 2023, fossil fuels are becoming increasingly scarce, Russia and Ukraine are at war, central banks are wielding their favorite sword, interest rates, left and right, and although new technologies are cornering the centralization that generates more and more distrust, this process is disruptive for markets and society in general.
It is argued that this is the time to build and that only careful and opportunistic investors will do well out of this situation.
Now we have Bitcoin trading in the range of 16900 USD and 16300 USD, after that great movement I was talking about at the beginning, caused by the collapse and bankruptcy of the FTX Exchange. I believe that we, the retail traders, who do not have first hand information on the financial markets, should try to observe the coming movements on the charts. And, I repeat, this is a very personal judgment but I can almost assure you that the impact of the FTX event was already on the chart before it happened. We did not know what in particular was going to unsettle the price of BTC, nor how it would do so, but before this whole issue started to be made public, a serious bearish divergence was already visible on the chart, and everything pointed to a crash to come.
Now the exact same thing is happening and I think that BTC could go for 20K.
Let's see.
In my analysis I use the TDI+RSI indicator, price action, supply and demand zones, volume and some institutional trading concepts.
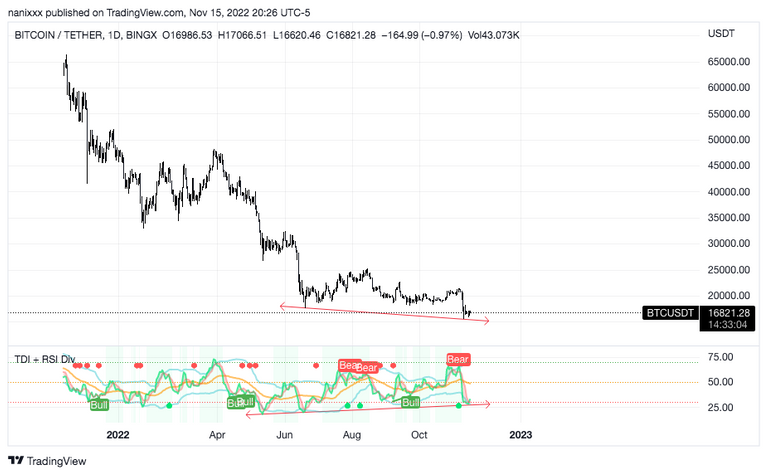
On a daily basis I notice a bullish divergence. If you don't know what it is, it occurs when price cycles create a lower low and at the same time a technical indicator is making a higher low.
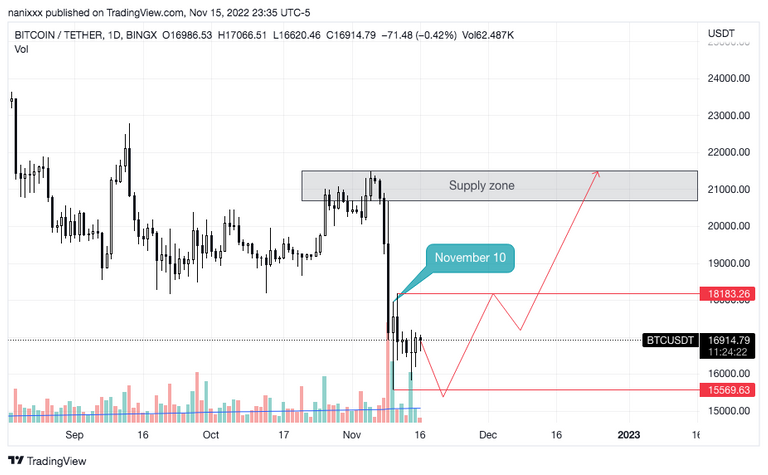
In terms of volume, as of the November 10 candle, there are a few tidbits that can be observed. And that is that in my opinion, the move that corresponds to that low-bodied, high-volume candle is not yet complete and would be just below its low (15569 USD). The next trade on November 11 is the opposite, the volume is minimal in relation to the body of the candle. This is telling me that the price is about to reverse and it did... it first drops below its low and turns around.
With this in mind, there could be one more move to the downside before going higher. The first point to reach would be 18183 before heading to the supply zone marked on the chart.
In the 15 min chart we can still get more information.
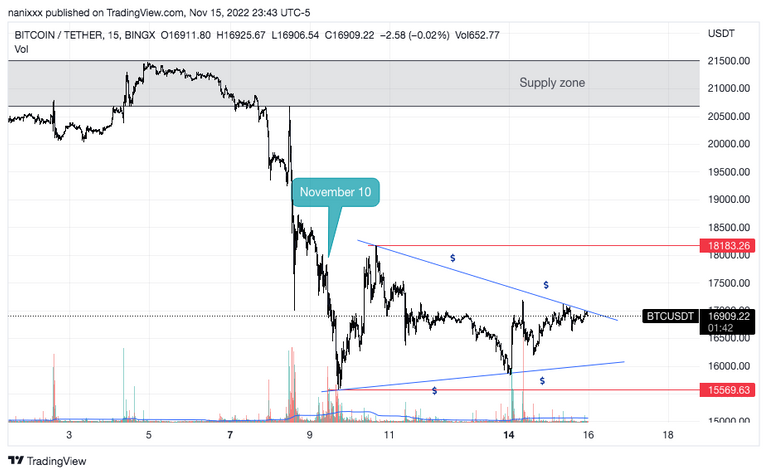
I think we are about to see a strong movement and this could happen in the next 72 hours perhaps.
There has been and will be a lot of volatility in the markets these days so I advise trading with low leverage and taking care of your capital management.
There is a phrase that I like to say a lot and it is <zero-anxiety-baby> 🐓... taking into account the control of your emotions, a phrase of John Templeton, one of the pioneers in the management of investment funds, comes to my mind: "The moment of maximum pessimism is the best time to buy and the moment of maximum optimism is the best time to sell."
Where do we stand now?
The banner was created in Canva and the charts are screenshots from my TradingView, also I used DeepL Translator to make this English version because my native language is Spanish.
https://twitter.com/1510327405214322694/status/1592765886771130369
The rewards earned on this comment will go directly to the people( @nanixxx ) sharing the post on Twitter as long as they are registered with @poshtoken. Sign up at https://hiveposh.com.
Congratulations @nanixxx! You have completed the following achievement on the Hive blockchain and have been rewarded with new badge(s):
Your next target is to reach 30 posts.
You can view your badges on your board and compare yourself to others in the Ranking
If you no longer want to receive notifications, reply to this comment with the word
STOPTo support your work, I also upvoted your post!
Check out the last post from @hivebuzz:
Support the HiveBuzz project. Vote for our proposal!