16 March My Technical Analysis
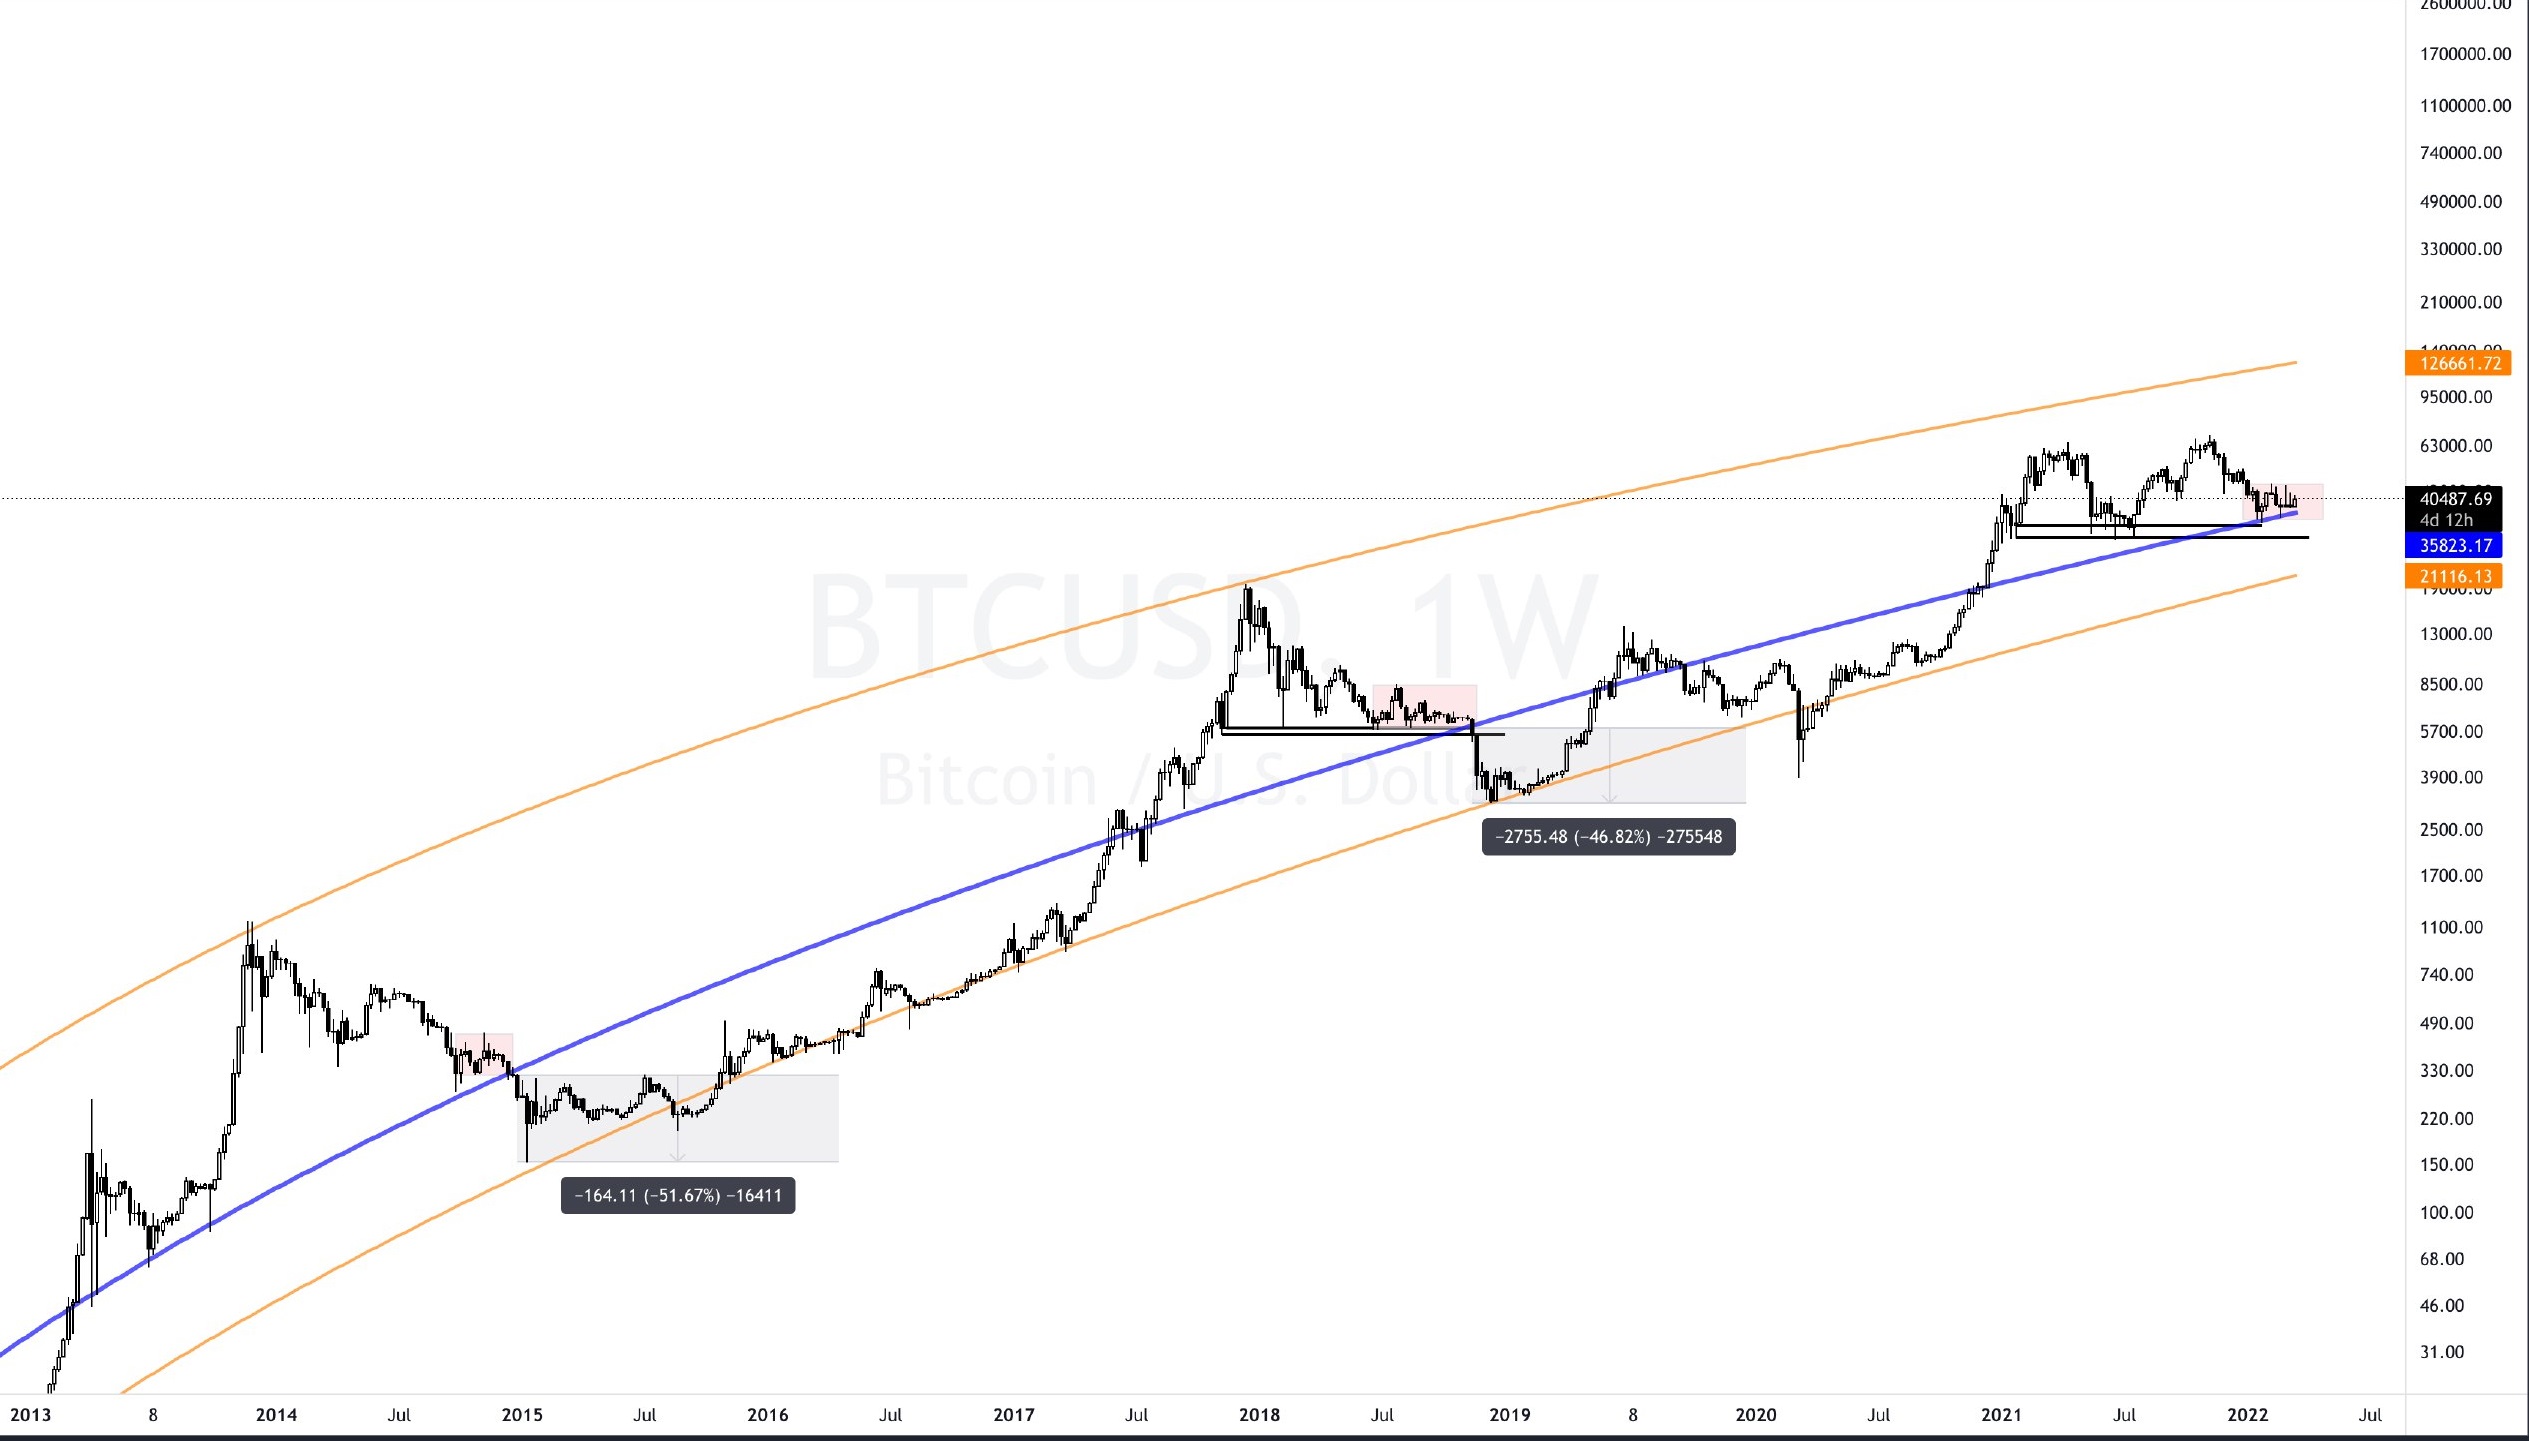
The blue regression value, which shows strong support from the $BTC regression values, is at 35823 this week. Be cautious in case of weekly closing below. As long as this support is not broken, frankly, there is no need for much fear. Let's continue to use this support in the coming weeks to understand exactly where we stand in $BTC history.
Although $BTC is holding on to the support, the price movements taking place here are not unlike the low volatility and shortening candles seen towards the end of 2018.
There are FED statements this week / today. Today we will all be in front of the screen, it will be a very active day again. Those in position need to shrink down and not apply too much leverage.
Again, there will be surprises.
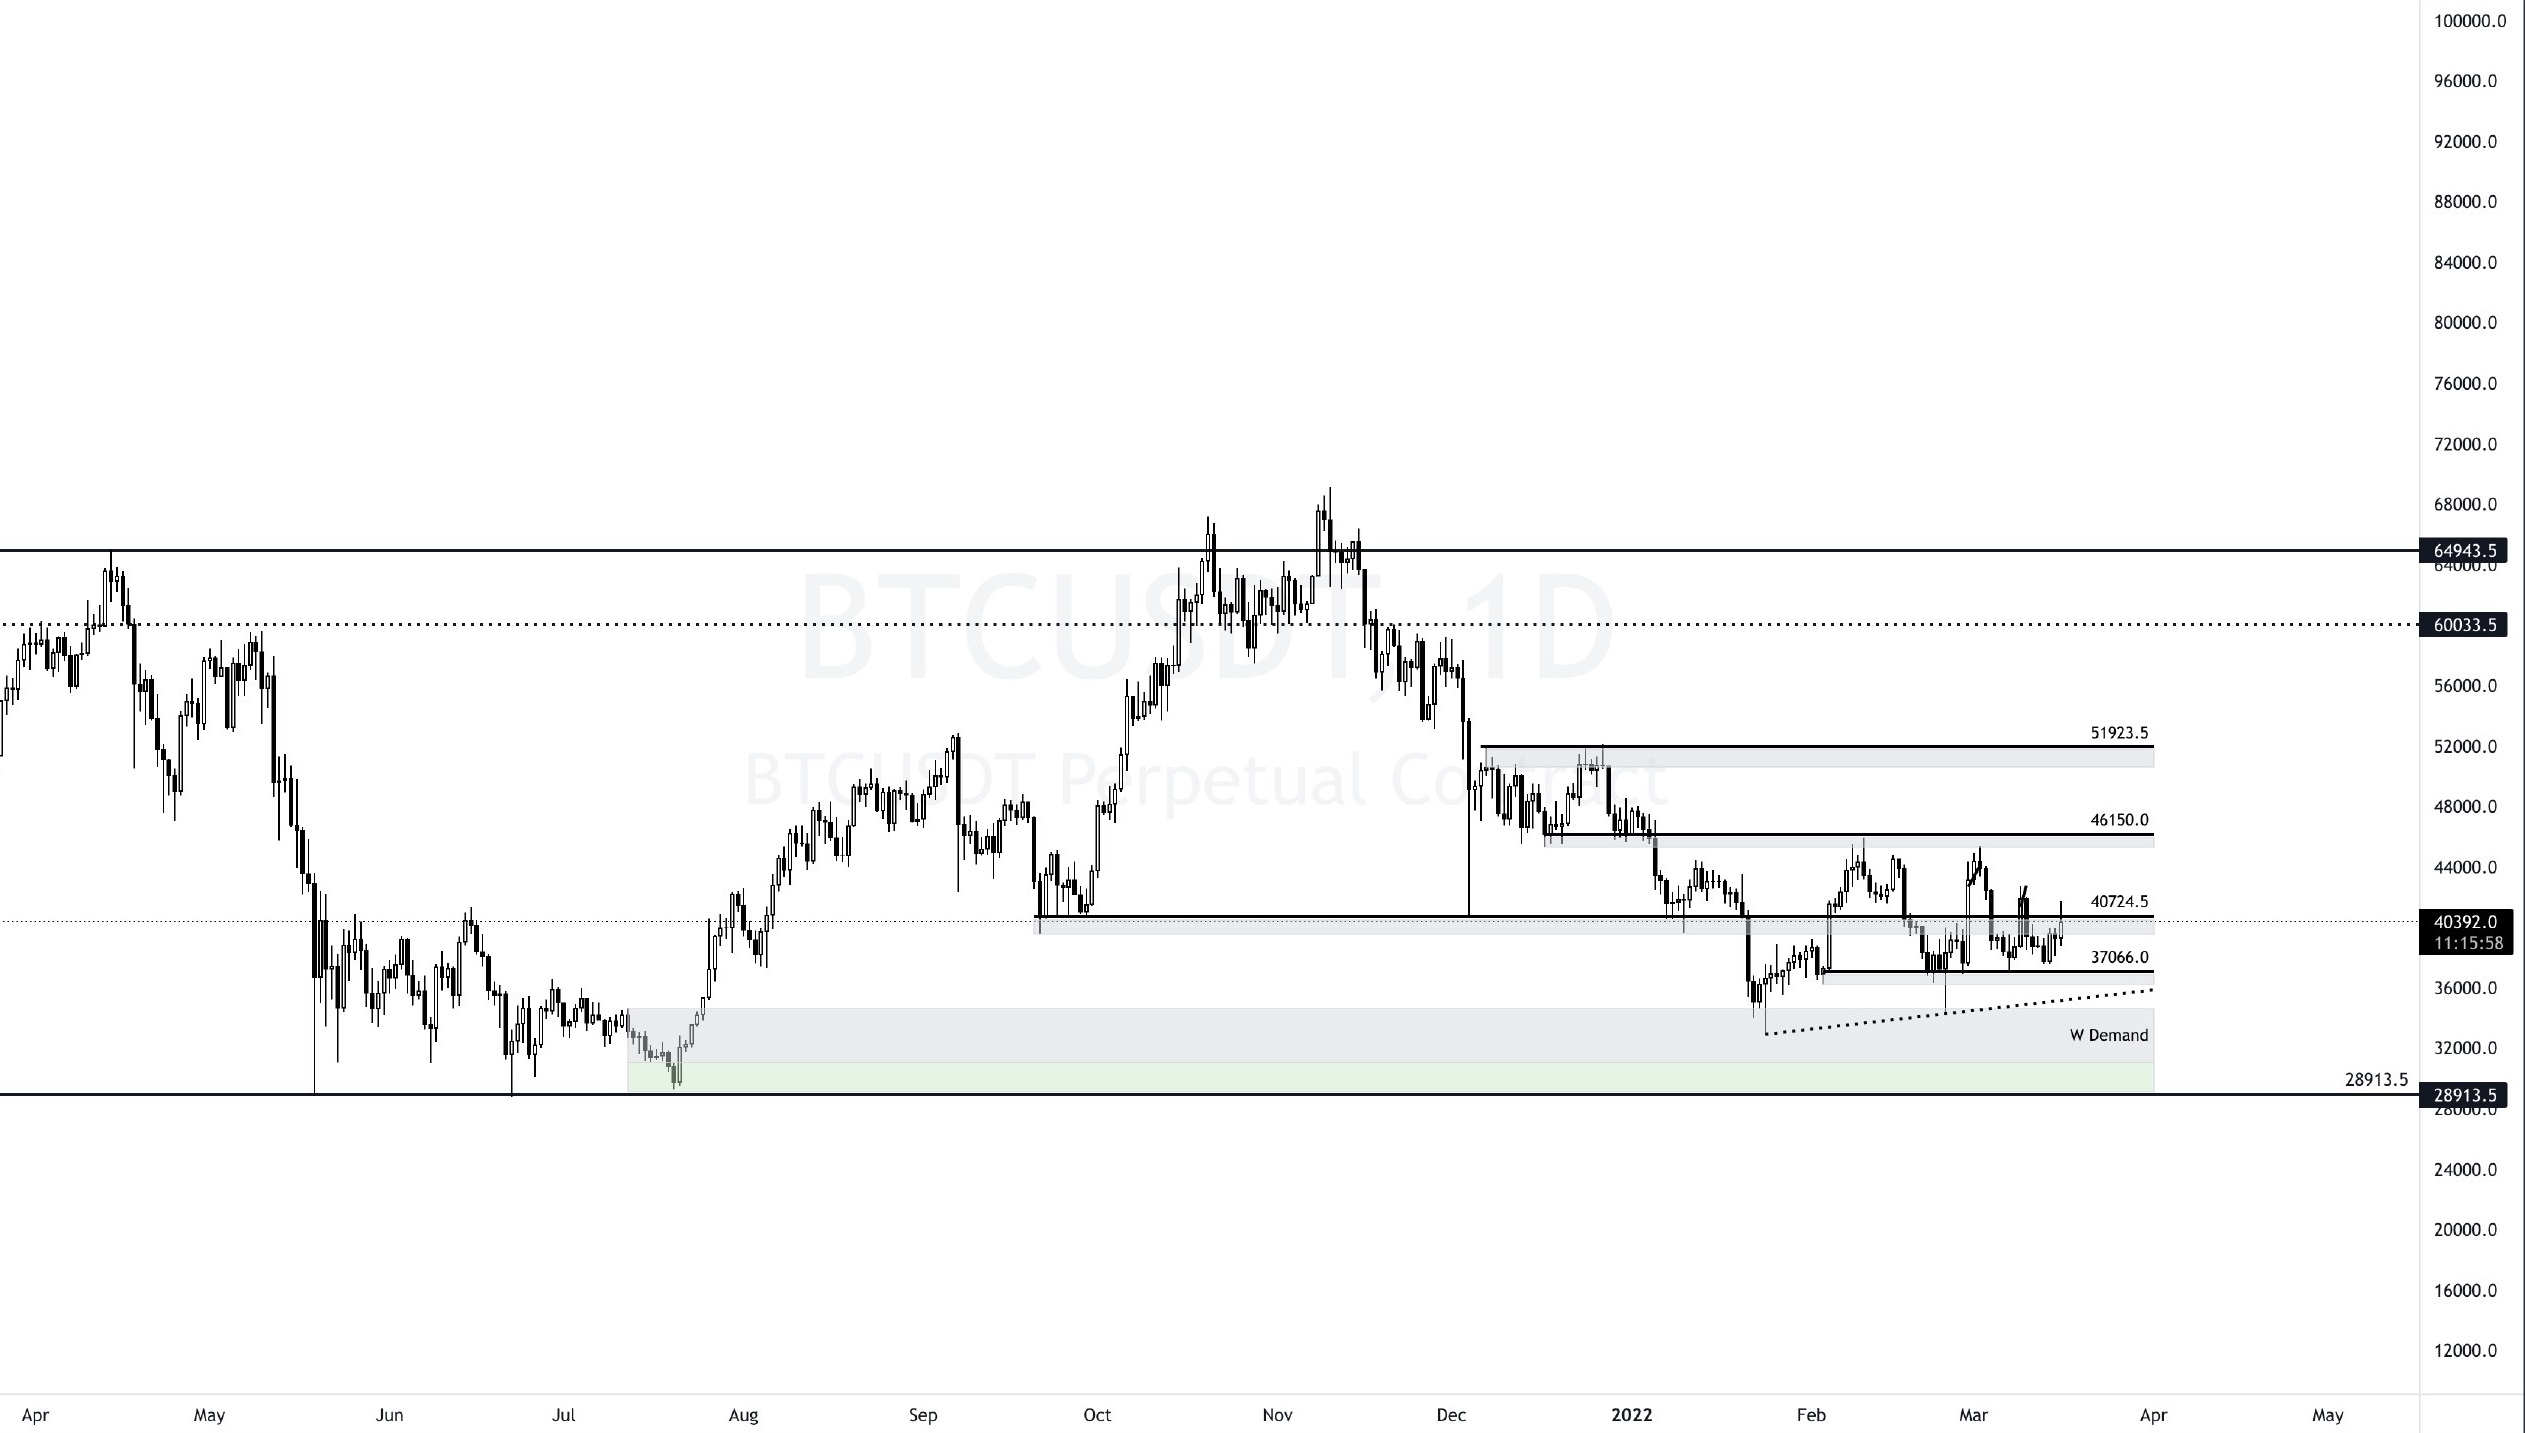
On the $BTC daily chart, we are spending the 7th day sequentially on the basis of closing in the range of 40.7-37.
The descending peaks above 40.7 indicate that there are still more sellers. I still think that a lower touch is needed, but this opinion should not affect you at all today, it does not matter in such days, if we expand the maturity, I expect a touch of around 35.5 in the future.
The FED decision will be a guide for today and beyond. There is a lot of indecision and pessimism in this region where we have been for a long time. If we leave here, we may come up with clearer trading ideas in the coming days.
25bps interest rate hike is likely to be priced in, so there may be some increase, but if 50bps comes, 2-3K sales may come at once. (my personal opinion)
I can't predict which way we will evolve before the hourly closes are above 40.7 or below 37 in a row. 35.5 below, 43.4 and 44.5 above, are the numbers that can be visited today at the time of the decision. There can also be hard turns from here.
I would say that those who have not traded on news days like this should not even touch their hands. Those who can trade can take a small exposure according to momentum on 1-3 min charts. You can use the numbers I wrote above for the turning places.
Let's not forget that we have seen before that if the candle of the initial movement with a high probability of surprise is taken back, we can go to the opposite side with the same strength.
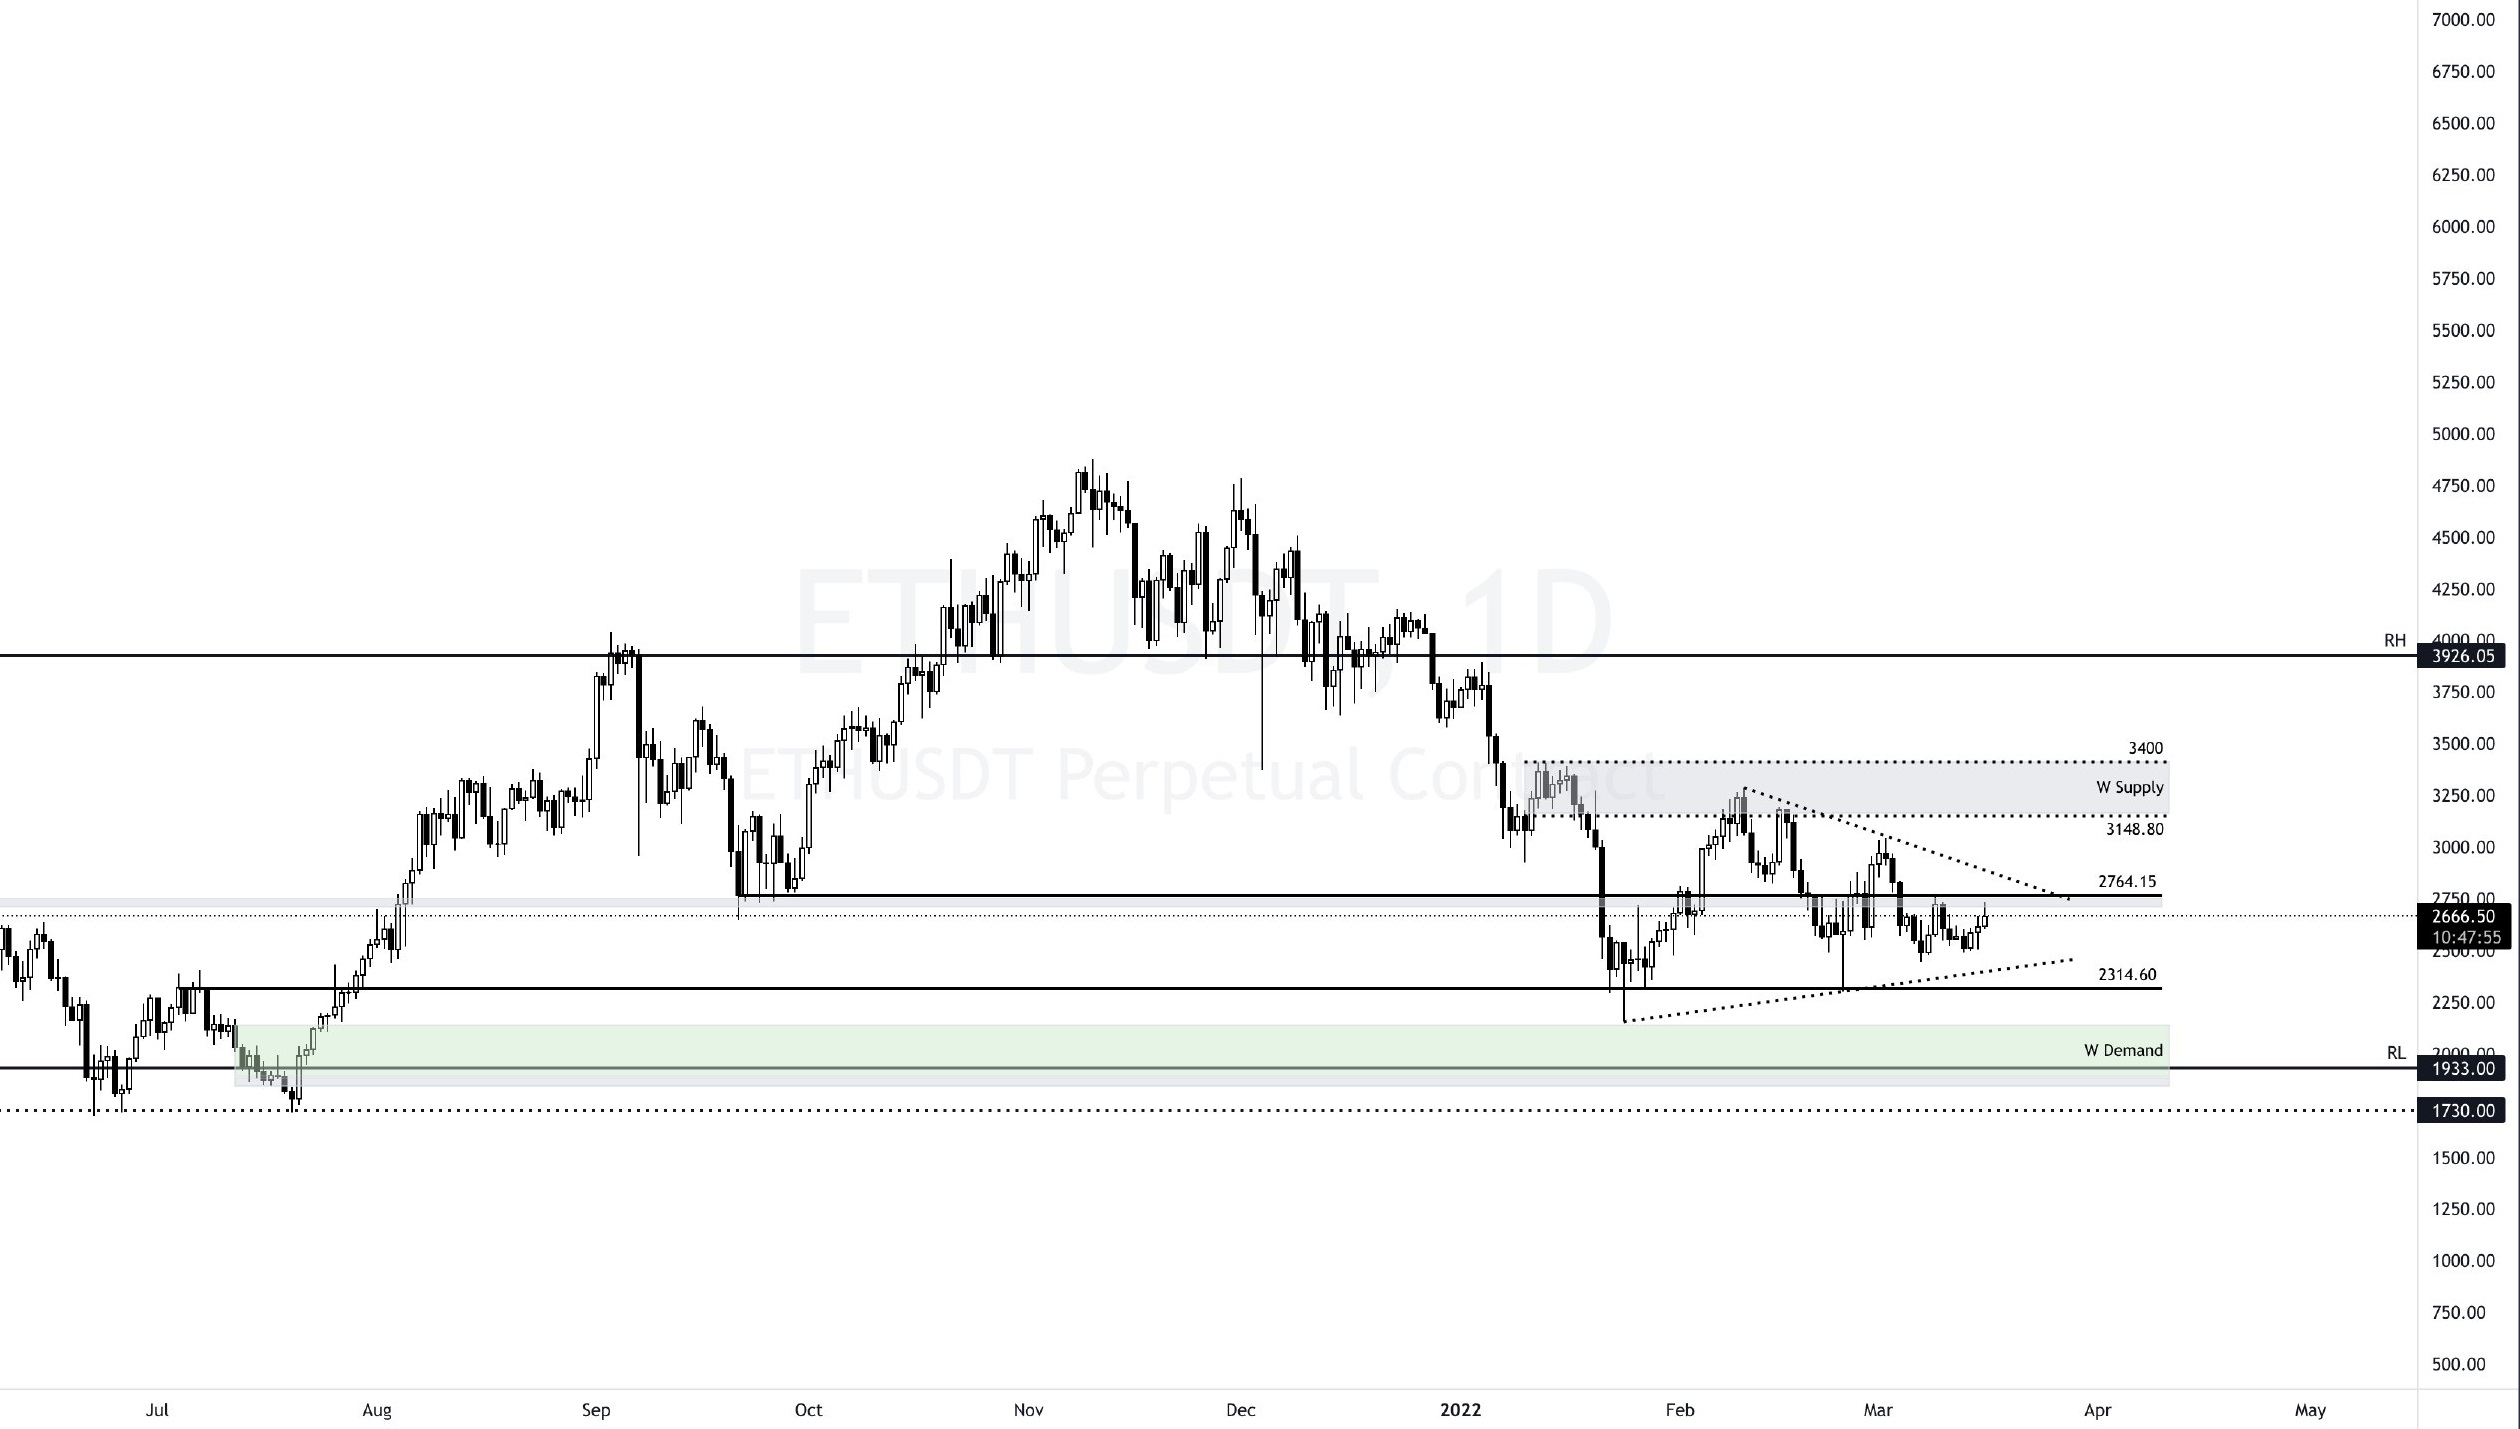
Unless it gives a daily close on #ETH 2764, it's hard.
As long as it is below 2764, the selling pressure will continue, but since the price movements will be surprising today, both sides of the formed triangle may be visited.
Sequence-independent first edge up then down edge or vice versa. If I see a needle on the edge where it will go first, I can open a reverse trade with a stop of around 2%.
I am not prejudiced since the actual movements that will give an idea about the direction have not yet emerged. Looking at the reactions of the short-term candles today, I am not in the mood to take risks from the front on the day of taking a small exposure.
Good luck with,
It is not investment advice.
Posted Using LeoFinance Beta