A red week ahead for Bitcoin?/ ¿Se aproxima una semana roja para el Bitcoin? [EN/ES]

Hello friends!
Two weeks ago I showed you my interpretation of the Japanese candlestick charts on the BTC/USDT pair in this post and here I bring you an update of the chart, as of today.
Hace dos semanas os mostré mi interpretación de los gráficos de velas japonesas sobre el par BTC/USDT en este post y aquí os traigo una actualización del gráfico, a fecha de hoy.
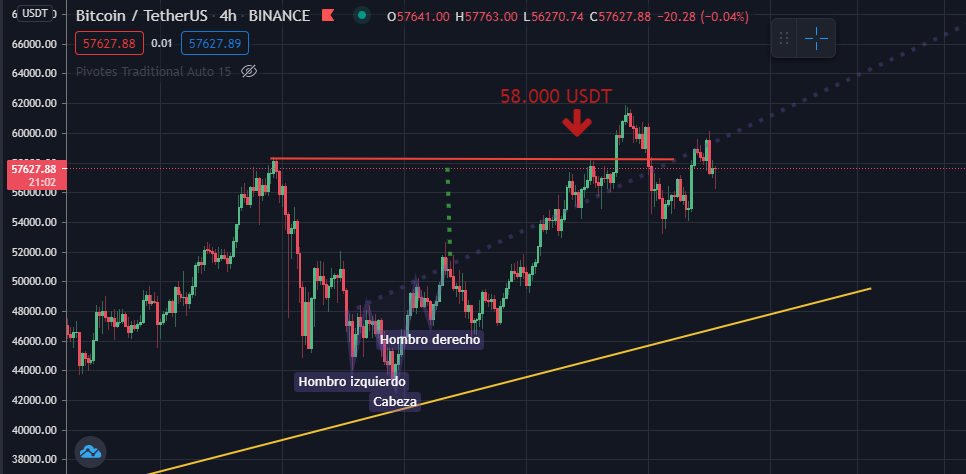
We can see that the analysis was perfectly fulfilled, reaching the value of 58000 USD according to the reversal pattern (Shoulder-Head-Shoulder) drawn on the chart.
We can even note that the buying strength at that moment when it reached 58,000 USDT was vast and managed to overcome the previous resistance, even positioning itself above 60,000 USDT (breaking a new historical record). However, the bulls could not sustain the value for too long, and the bears ended up counterattacking, depressing the price to the current values, at the time of this publication of 57700 USDT (below the 58K resistance, again).
Podemos ver que el análisis se cumplió perfectamente, alcanzando el valor de 58000 USD según el patrón de reversión (Hombro-Cabeza-Hombro) dibujado en el gráfico.
Incluso podemos notar que la fuerza compradora en ese momento en que alcanzó los 58.000 USDT fue vasta y logró superar la resistencia anterior, posicionándose incluso por encima de los 60.000 USDT (rompiendo un nuevo récord histórico). Sin embargo, los toros no pudieron sostener el valor por demasiado tiempo, y los osos terminaron contra-atacando, deprimiendo el precio hasta los valores actuales, en el momento de esta publicación de 57700 USDT (por debajo de la resistencia de 58K, nuevamente).

Now, what I observe for the following weeks, looking at the chart in a time frame greater than 4 hours, specifically in 1 Day periodic candlesticks, is the following:
Ahora, lo que observo para las siguientes semanas, mirando la gráfica en una temporalidad mayor a 4 horas, especificamente en velas periodicas de 1 Día, es lo siguiente:
Temporality 1 Day
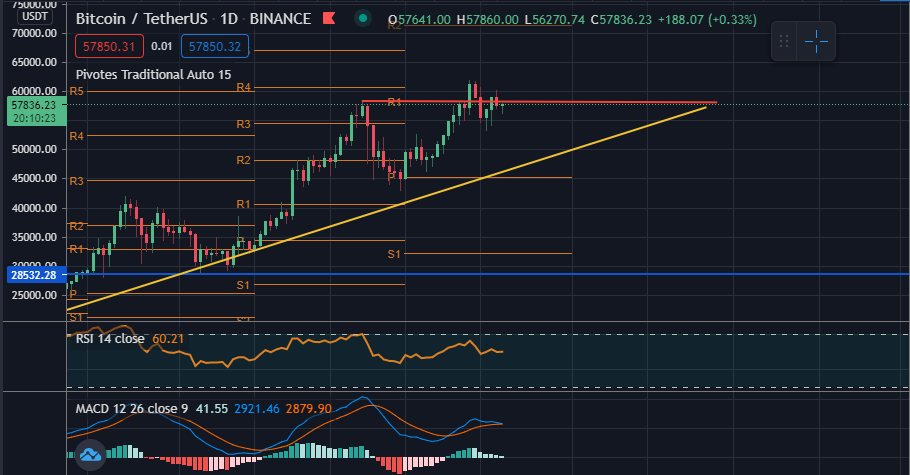
Maybe it is still too early to say, but if we take into account that the resistance at 58000 USDT (red line) is being very strong, an ascending triangle (support; yellow line) could start to develop in the next few days.
If so, we could see the value of the BTCUSDT pair drop to 45000 USDT or thereabouts, then bounce off the support (yellow line), and retest the 58000 USDT resistance (red line).
We can also observe that the MACD is about to make a bearish crossover between its lines, which may support the previous indication.
Curious fact: The weekly pivot point is exactly at 45240 USDT and the resistance number 1 (of the weekly pivots), is at 58240 USDT, even if it does not draw an ascending triangle as I think, it seems that the pivot points indicate that the price will be moving between those two values.
If this is true, my recommendation is to trade very cautiously and be careful not to put more than 7% of the capital invested in the pair at risk.
Or, preferably trade in lower time frames and lower capital, looking for a sum of smaller returns, while the asset's movement is developing.
I have decided to shelter my capital in USDT until I have a clearer picture of where the price will go.
The key: To have patience and consistency in the plan.
Tal vez sea todavía demasiado pronto para decirlo, pero si tenemos en cuenta que la resistencia de 58000 USDT (línea roja) está siendo muy fuerte, podría empezar a desarrollarse un triángulo ascendente (soporte; línea amarilla) en los próximos días.
De ser así, podríamos ver el valor del par BTCUSDT bajar hasta los 45000 USDT o por ahí, para luego rebotar en el soporte (línea amarilla), y volver a probar la resistencia de los 58000 USDT (línea roja).
También podemos observar que el MACD está a punto de realizar un cruce bajista entre sus líneas, lo que puede apoyar la indicación anterior.
Dato curioso: El punto pivote semanal está exactamente en 45240 USDT y la resistencia número 1 (de los pivotes semanales), está en 58240 USDT, aunque no dibuje un triángulo ascendente como creo, parece que los puntos pivotes indican que el precio se va a mover entre esos dos valores.
Si esto es cierto, mi recomendación es operar con mucha cautela y tener cuidado de no poner en riesgo más del 7% del capital invertido en el par..
O bien, operar preferentemente en marcos temporales más bajos y con menor capital, buscando una suma de rendimientos menores, mientras se desarrolla el movimiento del activo.
He decidido refugiar mi capital en USDT hasta tener una idea más clara de hacia dónde irá el precio.
La clave: Tener paciencia y consistencia en el plan.*
Finally, I remind you, you who read me, to trade carefully, always having a clear Stop Loss, to avoid big losses in case the price does not go in the indicated and expected direction.
Por último, te recuerdo, tú que me lees, que operes con cuidado, teniendo siempre un Stop Loss claro, para evitar grandes pérdidas en caso de que el precio no vaya en la dirección indicada y esperada.
If you want to join Binance Exchange, click here and SIGN UP

If you are interested in belonging to the Erarium community (even if you only speak English), you can access our discord server here, where you will have access to more financial information and we can team up to make investments, trading and financial strategies.
In addition, you can follow us on our social networks, to offer you more interesting information about technical analysis, courses, personalized attention, airdrops, cryptocurrency bots and much more.
Si estás interesado en pertenecer a la comunidad de Erarium (incluso si hablas únicamente Ingles), puedes tener acceso a nuestro servidor en discord aquí, donde tendrás acceso a mayor información del tipo financiero y podemos formar equipo de trabajo para realizar inversiones, trading y estrategias a nivel financiero.
Además, puedes seguirnos en nuestras redes sociales, para ofrecerte más información interesante sobre análisis técnico, cursos, atención personalizada, airdrops, bots de criptomonedas y mucho más.
All images have been captured or made by me, and candlestick charts made in TradingView.
Sin más que agregar, me despido
ROCEJUMA

Posted Using LeoFinance Beta