Technical Analysis: Bitcoin 18/01 [ES/EN]
.png)
ESPAÑOL
Espero que estén teniendo un bonito día. Quise dar un avance de cómo viene desarrollándose el movimiento del Bitcoin, que siempre es fundamental conocer para poder entender qué harán las otras criptomonedas y tokens.
En el post anterior, les plantee en un marco temporal diario, que el precio estaba por marcar dos rutas muy claras; una de color verde y otra de color rojo, siendo lógicamente una alcista y otra bajista, respectivamente.
Aquí puedes ver el post que fue realizado hace 3 días: Post de análisis anterior.
En este post, mostraba esta imagen de la gráfica de velas diarias, con una perspectiva mayor del precio:
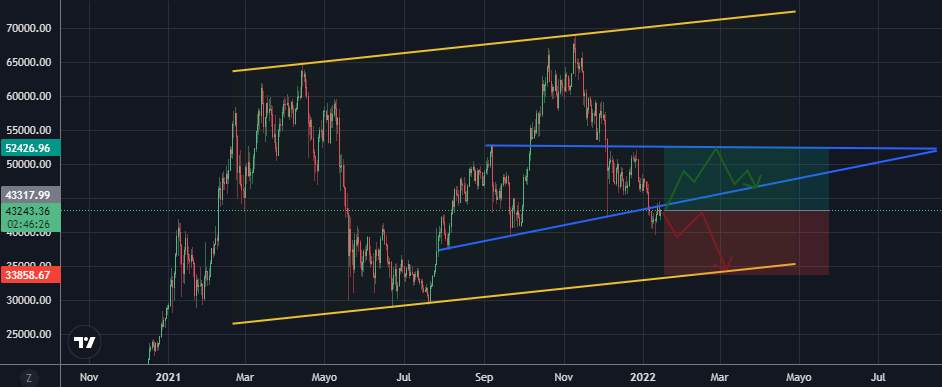
Con el pasar de estos dos últimos días, parece que se viene definiendo la intención del mercado BTC/USDT, que ha decidido tomar la ruta roja o bajista, al menos por ahora, y ha demostrado una disminución de 1500 USD en al menos 24 horas.
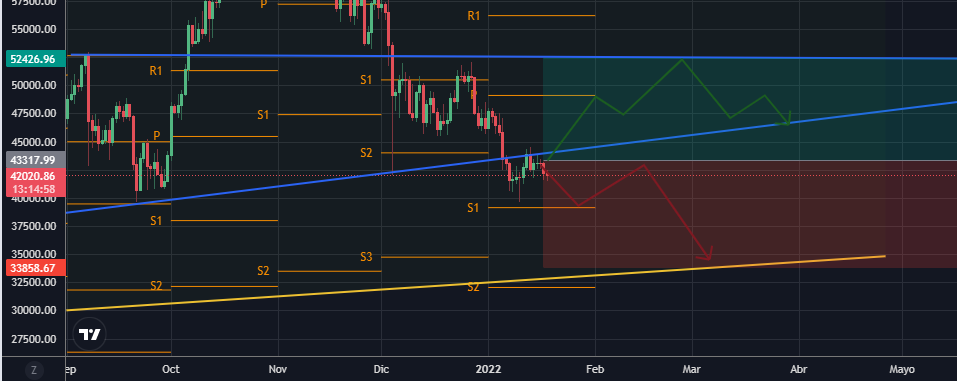
Como se puede ver en esta imagen más cercana, el valor esta haciendo un movimiento descendente que se ha visto frenado por un soporte muy fuerte en los 41500 USDT - hace un par de semanas fue testeado el mismo soporte, sin éxitos de poder traspasarlo -. Sin embargo, considero que el activo llegará, al menos a la zona de los 40.000 USD que coincide en la imagen con el Soporte S1 de los pivotes semanales.
Creo incluso que hoy, con la apertura del mercado Estadounidense, podríamos ver ese descenso rápidamente y que por ser una zona probable de mucha compra, encontraríamos un nuevo rebote hacia los 43000 USDT nuevamente, haciendo creer al mercado que ahora si vamos para arriba. Cuando lo cierto es (según lo que muestran los gráficos) es que nos encontramos por debajo del cuello de un patrón bajista (**Hombro-Cabeza-Hombro), que podría llevarnos mucho más abajo.
Según lo que yo he podido ver, el siguiente movimiento sería descendiendo hasta los 33000-34000 USDT, que es donde finaliza la ruta roja trazada por mi en el gráfico y que además permitiría hacer contacto con el soporte del canal ascendente trazado en el gráfico diario (lineas color amarillo).
Tomando en cuenta que todo esto es únicamente con carácter informativo, les deseo mucho éxito en su camino de bajada a los precios mencionados. Y de ser, al contrario un camino de subida, igualmente espero que sepan aprovecharlo a tiempo.
Muchas gracias

ENGLISH
I hope you are having a nice day. I wanted to give a preview of how the Bitcoin movement has been developing, which is always essential to know in order to understand what the other cryptocurrencies and tokens will do.
In the previous post, I posed to you in a daily time frame, that the price was about to mark two very clear routes; one green and one red, being logically one bullish and one bearish, respectively.
Here you can see the post that was made 3 days ago: Previous analysis post.
In this post, I showed this image of the daily candlestick chart, with a larger perspective of the price.
With the passing of these last two days, it seems that the intention of the BTC/USDT market has been defining, which has decided to take the red or bearish route, at least for now, and has shown a decrease of 1500 USD in at least 24 hours.
As you can see in this closer image, the value is making a downward movement that has been stopped by a very strong support at 41500 USDT - a couple of weeks ago the same support was tested, without successes of being able to break through it -. However, I believe that the asset will reach at least the 40,000 USD area, which coincides in the image with the S1 Support of the weekly pivots.
I even believe that today, with the opening of the US market, we could see that decline quickly and that being a likely area of much buying, we would find a new rebound towards 43000 USDT again, making the market believe that now we are going up. When the truth is (according to what the charts show) is that we are below the neckline of a bearish pattern (**Shoulder-Head-Head-Shoulder), which could take us much lower.
According to what I have been able to see, the next move would be down to 33000-34000 USDT, which is where the red route traced by me on the chart ends and which would also allow us to make contact with the support of the ascending channel traced on the daily chart (yellow lines).
Taking into account that all this is for information purposes only, I wish you all success in your way down to the mentioned prices. And if it is, on the contrary, an upward path, I hope you will be able to take advantage of it in time.
Thank you very much
If you want to join Binance Exchange, click here and SIGN UP

Posted Using LeoFinance Beta