2 May My Technical Analysis
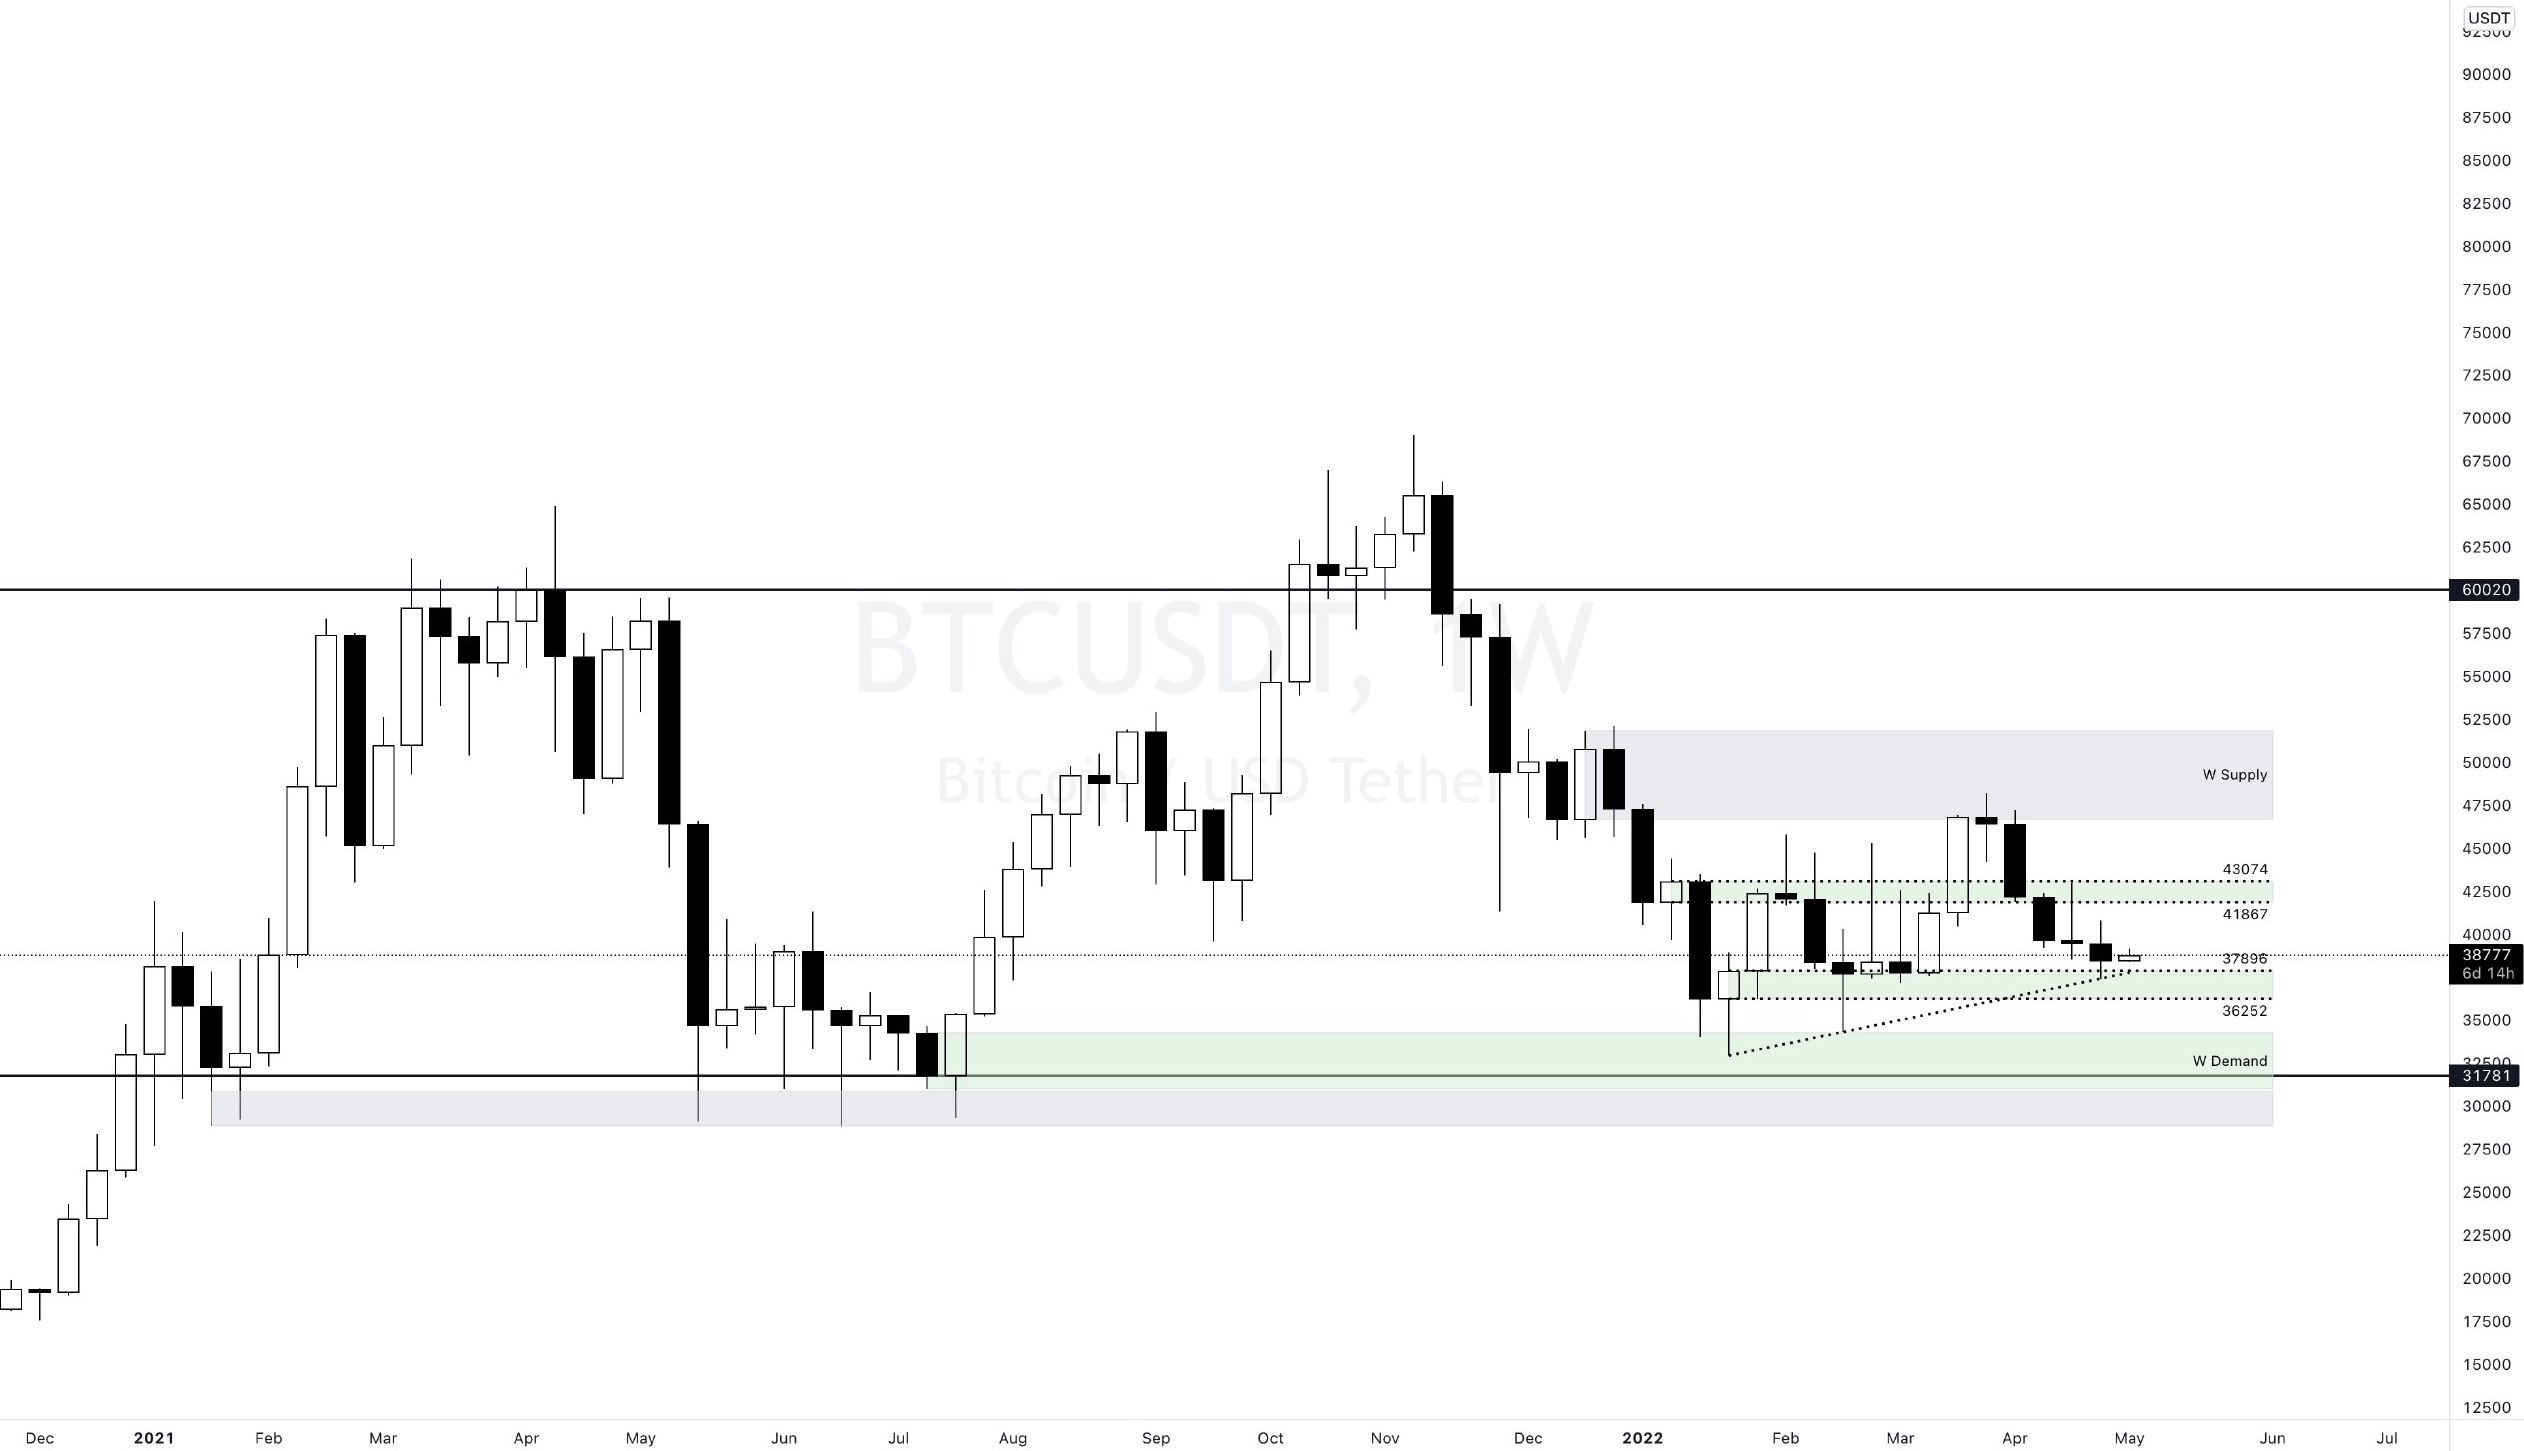
On the weekly chart of $BTC, trend contact has arrived, causing a slight uptrend, but nothing to trigger more yet. I don't see anything that will turn the main direction up yet.
The real price movements begin with the FED meeting on Wednesday.
There is nothing to give hope yet, but let's not tie the knot.
The Fed decision may have been priced at 50bps expected. A rate hike above 50 bps may shock the markets again.
36200 support below is still more important, a contact here is possible. If the FED rate hike is above the expected, I think it will visit the demand zones marked on the chart.
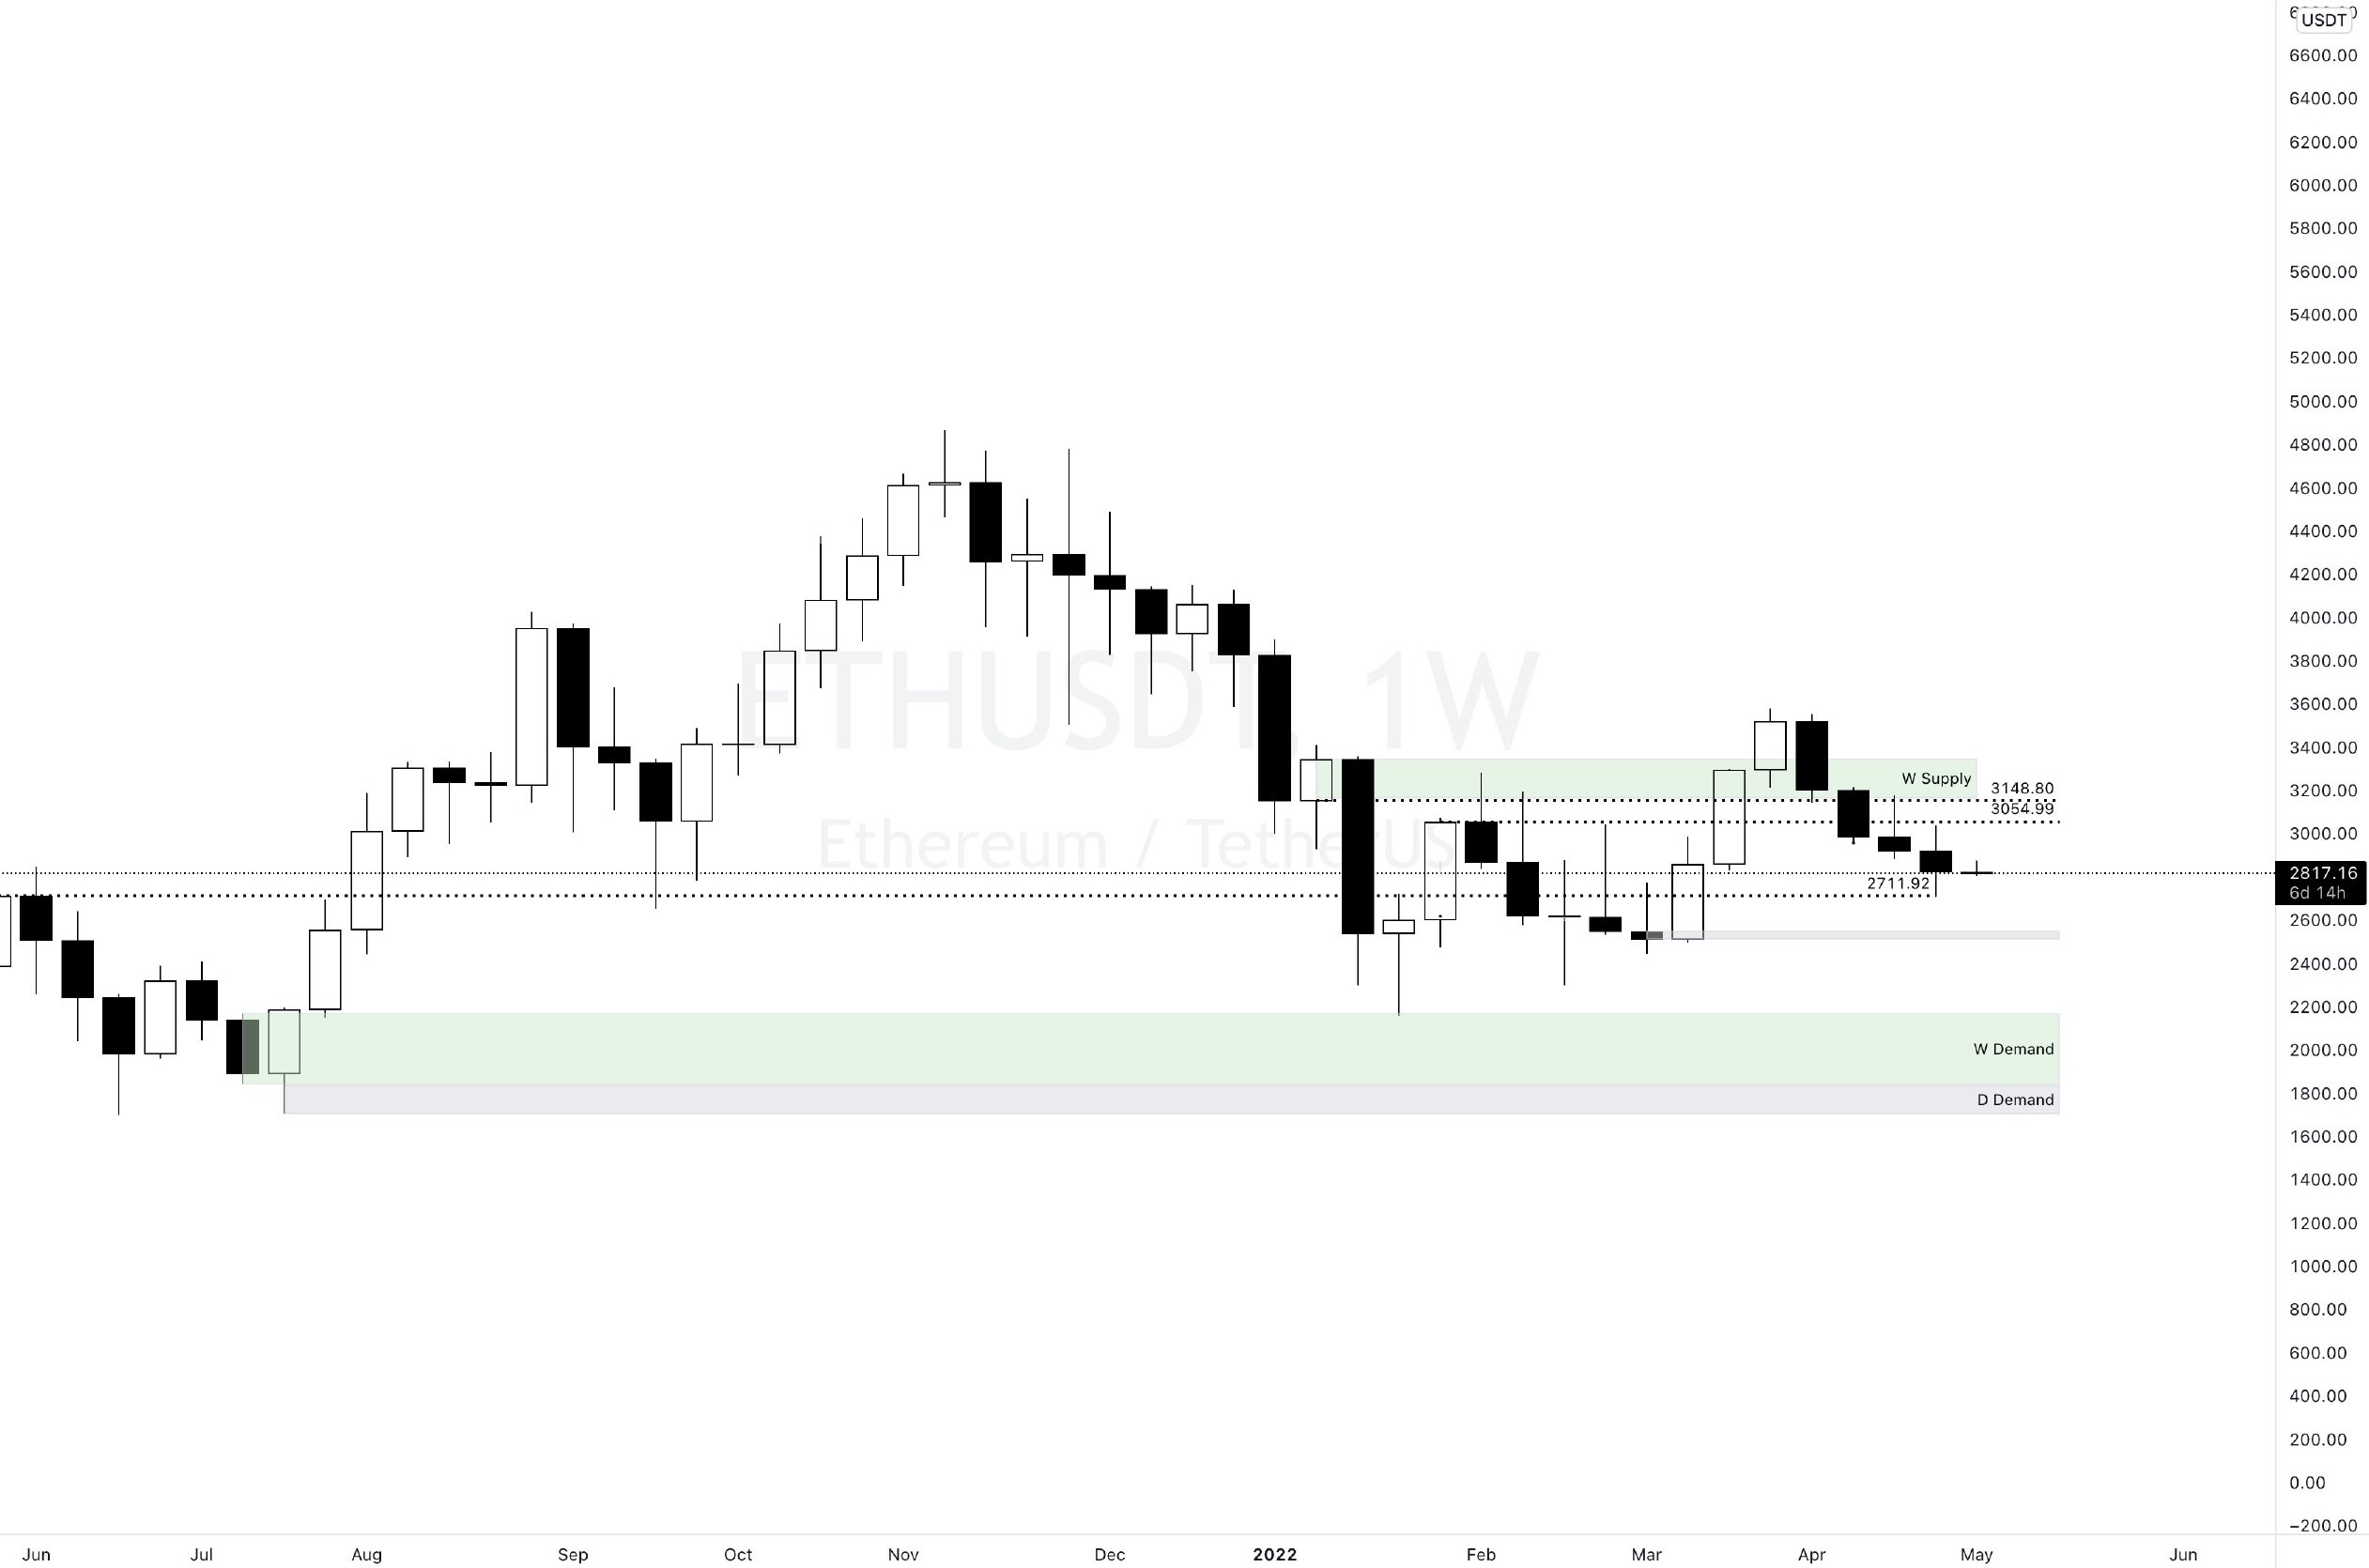
I said that $ETH 2711 is still among my expectations as a closer target, a contact here and even a contact to 2550's, which is a gray block.
2711 has arrived 🎯
In addition, we said that you can play on the reaction using these numbers, and the premium is around 5%.
If closings start below 2752, we look at the next figure, 2500/2550. In the short term, if 2884 is exceeded for the above, the rise may continue until around 2960. The weight and power I see is still on the selling side, so still more ups and downs are considered as selling opportunities.
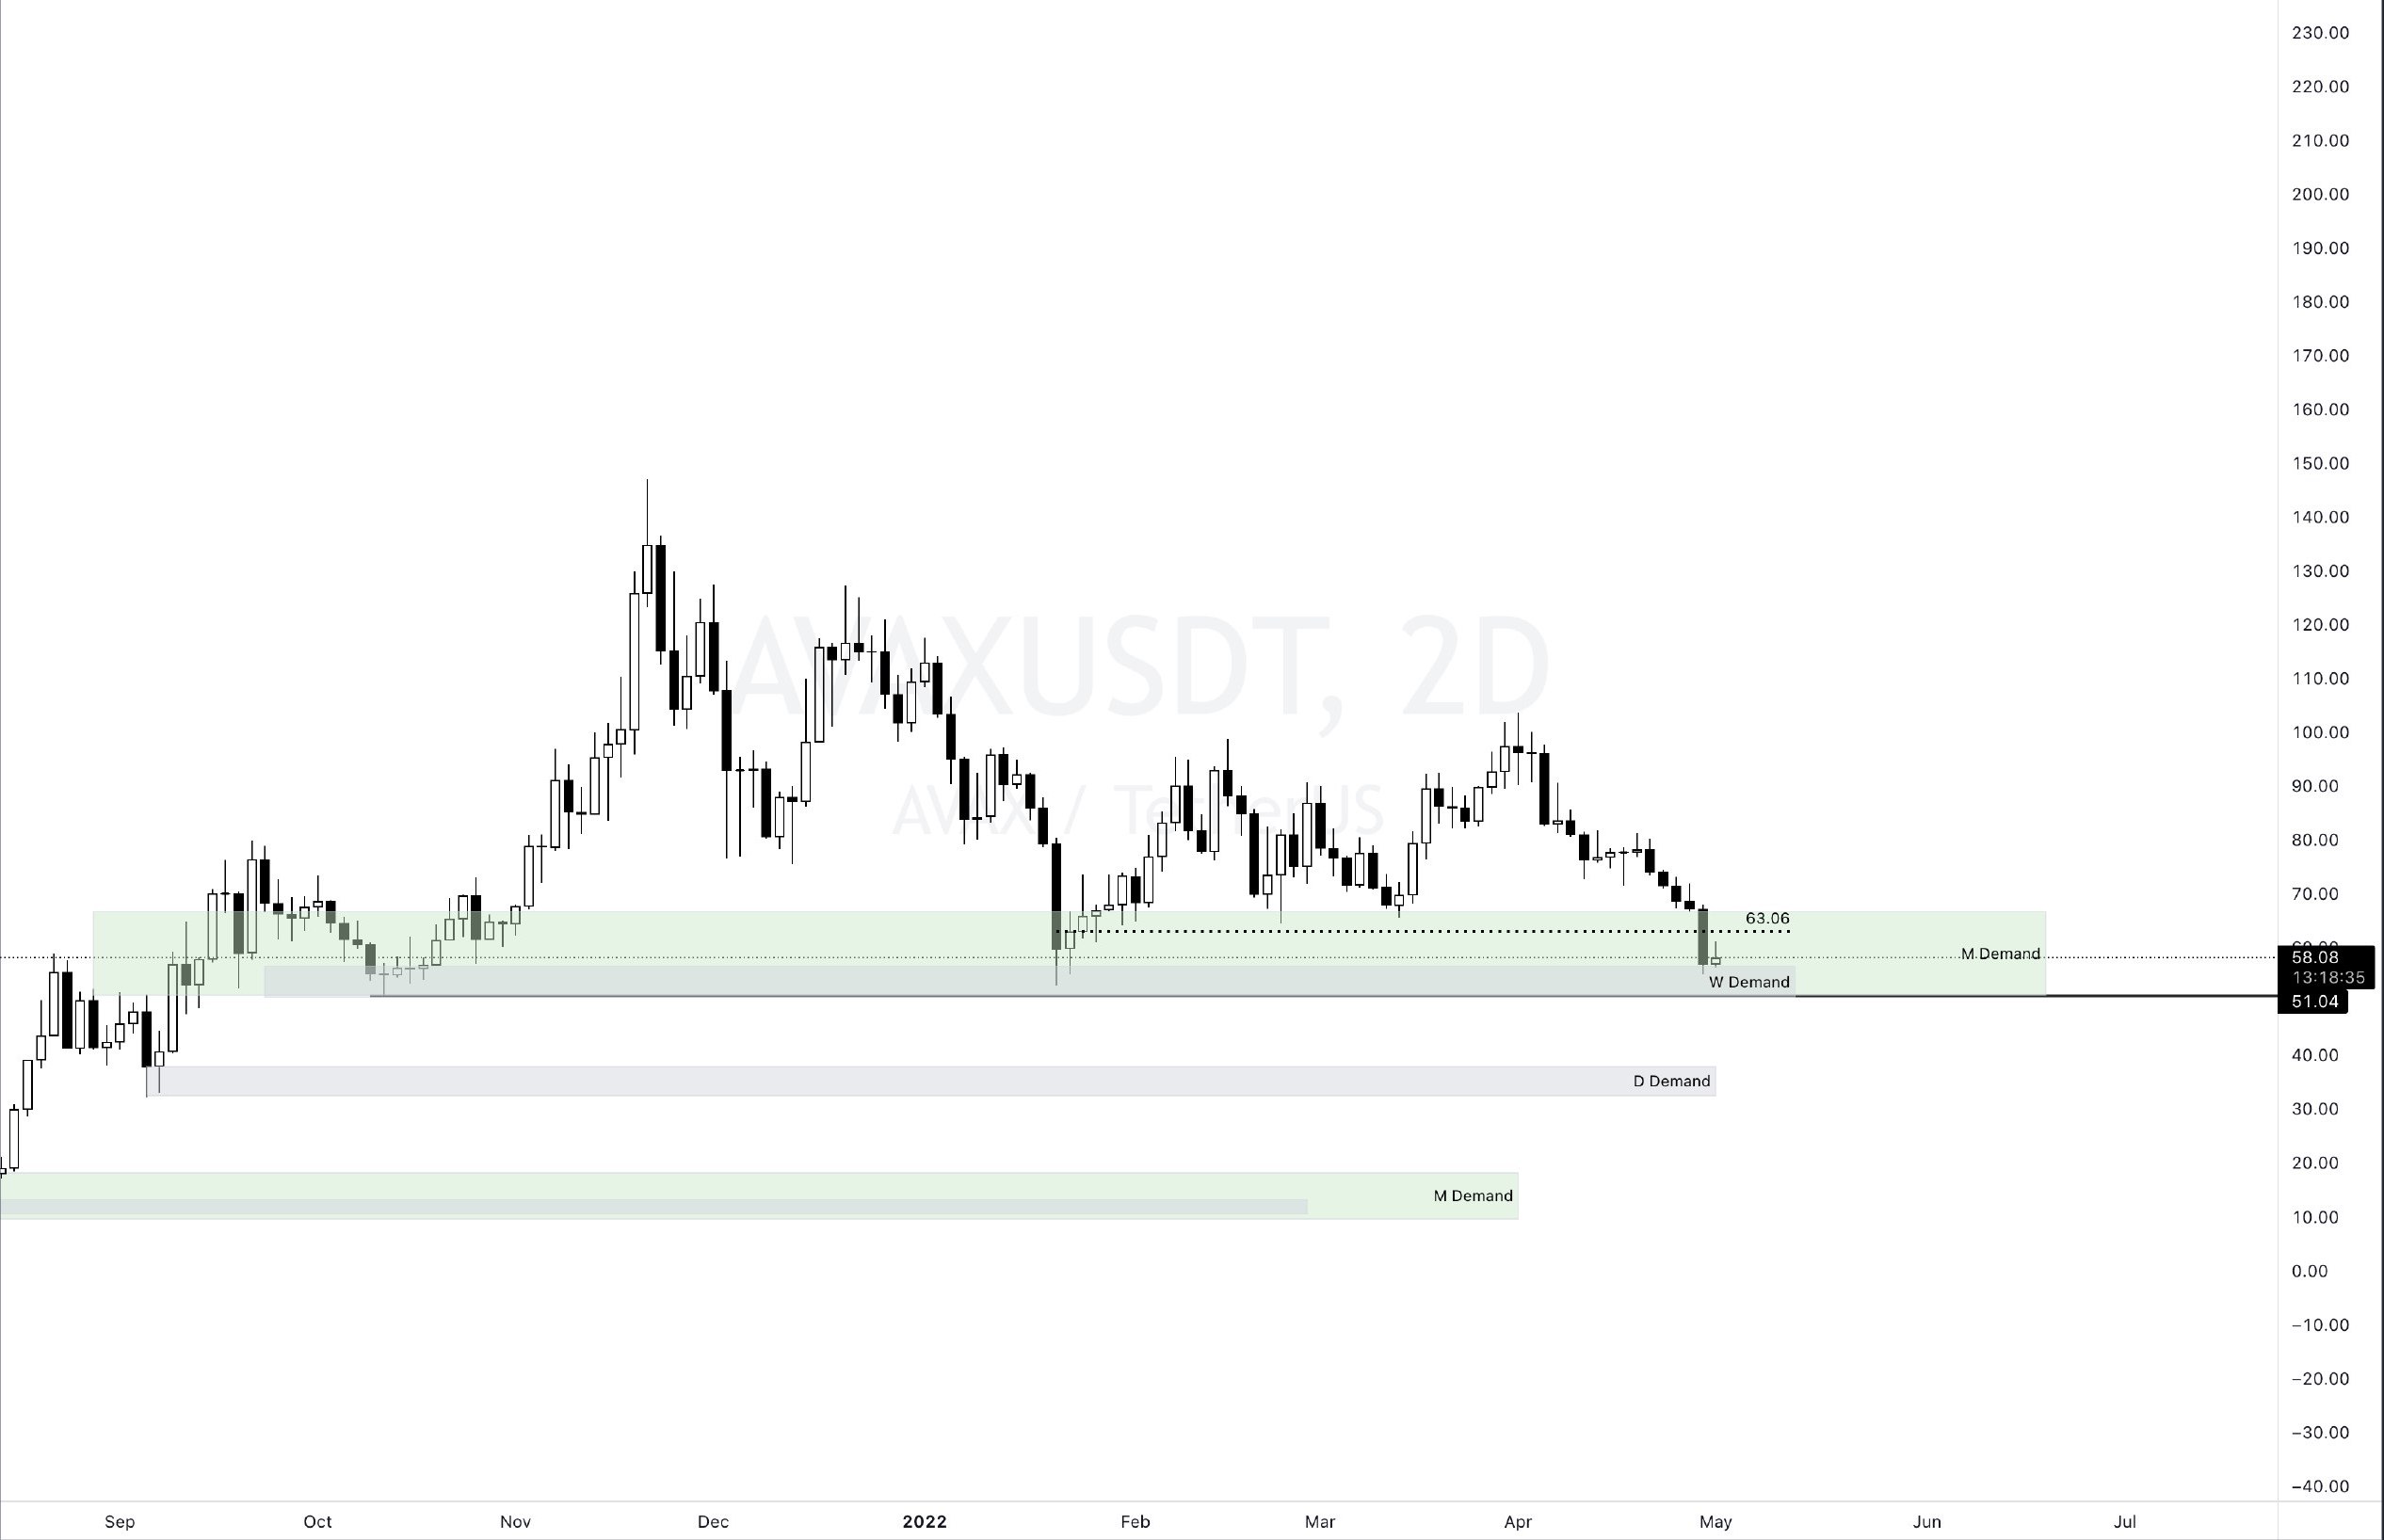
$AVAX has support around 63, I said if it can't hold on a daily basis, we'll talk about 56 and 50. It went down to 55's. ✅ The possibility of visiting the 50's is still on the table.
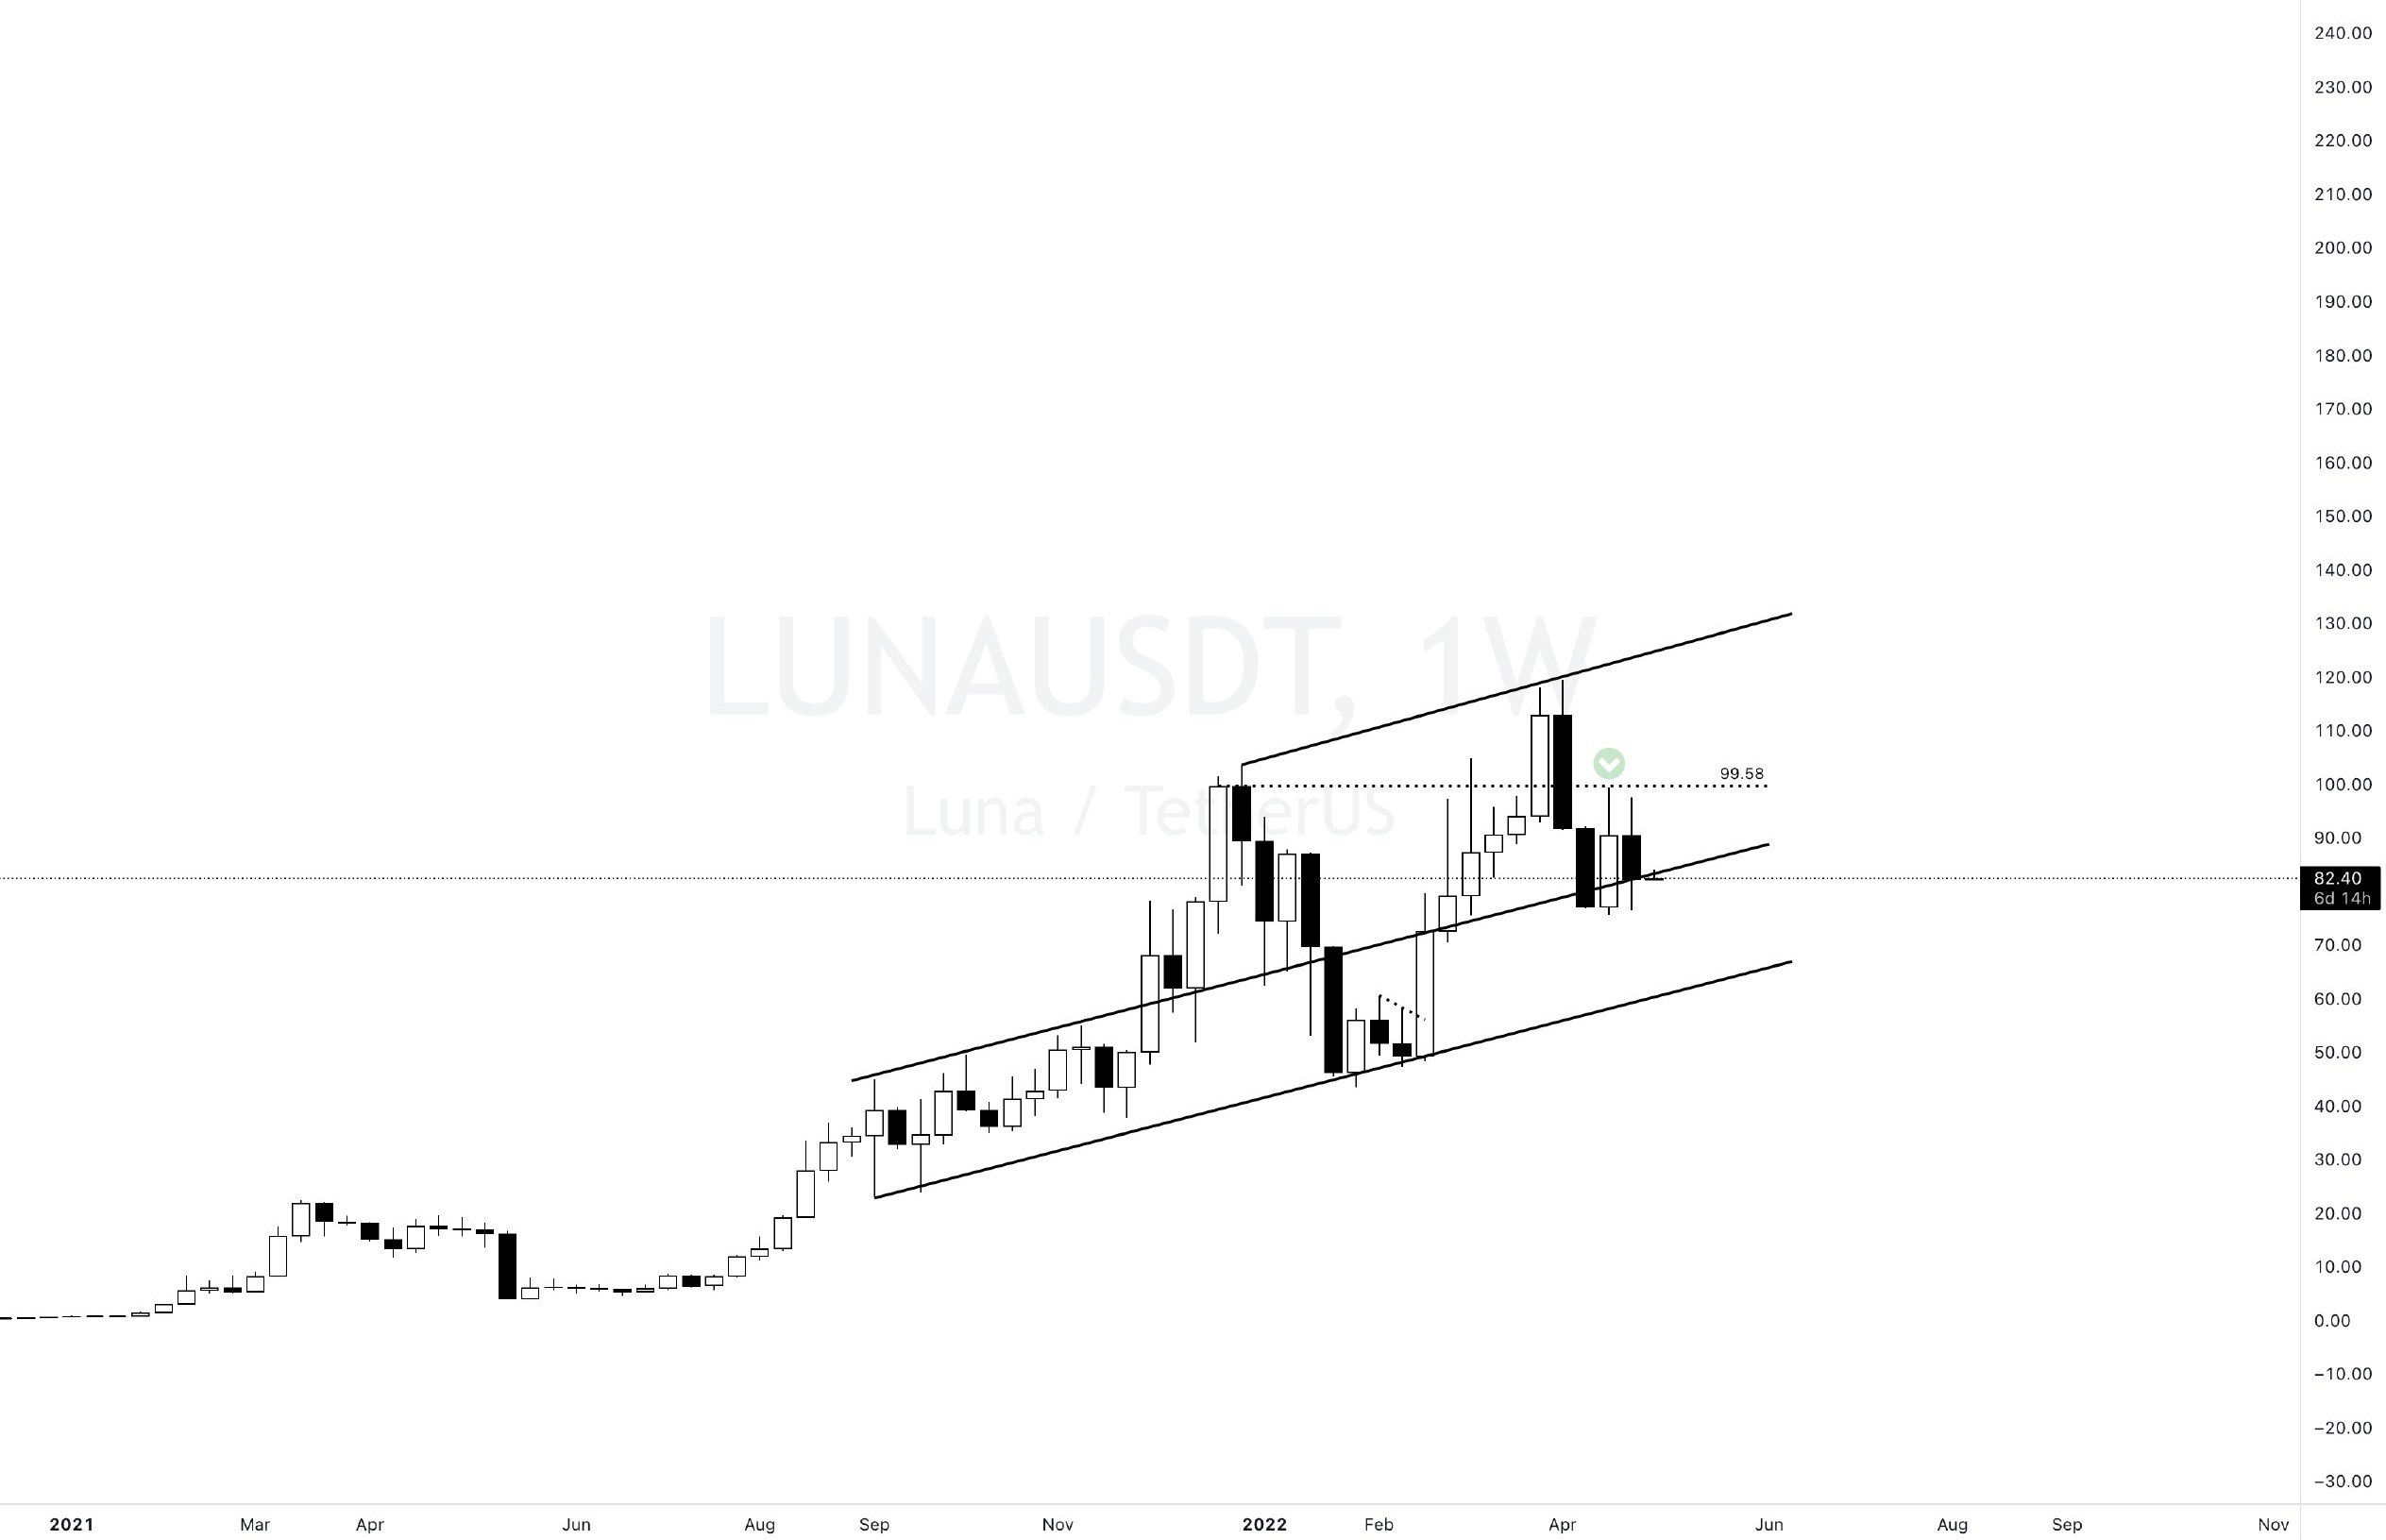
$LUNA is below trend and closed at critical point downtrend is higher than bullish in my opinion. If the closures on the channel do not come, the channel bottom visit that I mentioned in the previous analysis may take place.
Take it easy,
It is not investment advice.
Graph Source: Tradingvie
Posted Using LeoFinance Beta