This Is Not The 1970s
We see a lot of insanity in trying to compare what is taking place today to what happened in the United States in the 1970s. Words such as hyperinflation and stagflation keep being tossed around. Sadly, it is by a bunch of people who really have little clue about economics, worshipping the likes of Peter Schiff and his gold bug agenda.
The reality is that we are dealing with completely different circumstances. What is similar is that both times has supply chain shocks. Outside of that, we are dealing with different mechanisms as compared to then.
For this reason, we are not going to see either of those scenarios. Those espousing these points of views are going to be on the wrong side of the equation again. If it any wonder that masses are wrong.
Velocity of Money
The Velocity of Money is a major component on the economy. When it is stable, the altering of the monetary base has an impact. In the 1970s, we were dealing with a rather stable VoM. Today, that is not the case (nor for the last two decades).
Notice how from 1970 through 1978 the VoM was rather stable. After that, it started to rise a bit through the rest of the decade.
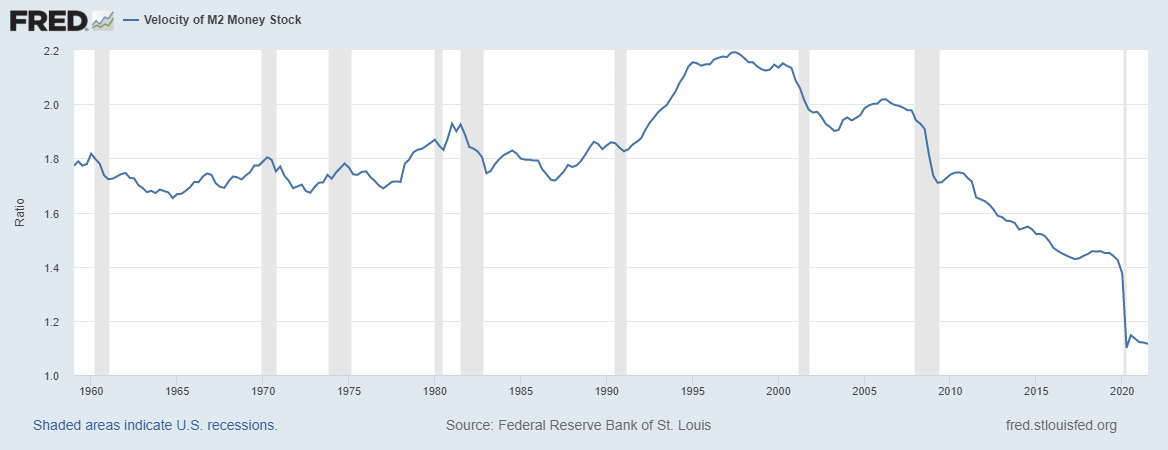
Now let us contrast that with today. Focus upon what the chart looks like from 2010. Would you describe that as stable? Obviously not. Hence the difference. When the VoM is not stable, the impact upon the economic demand curve is reserved.
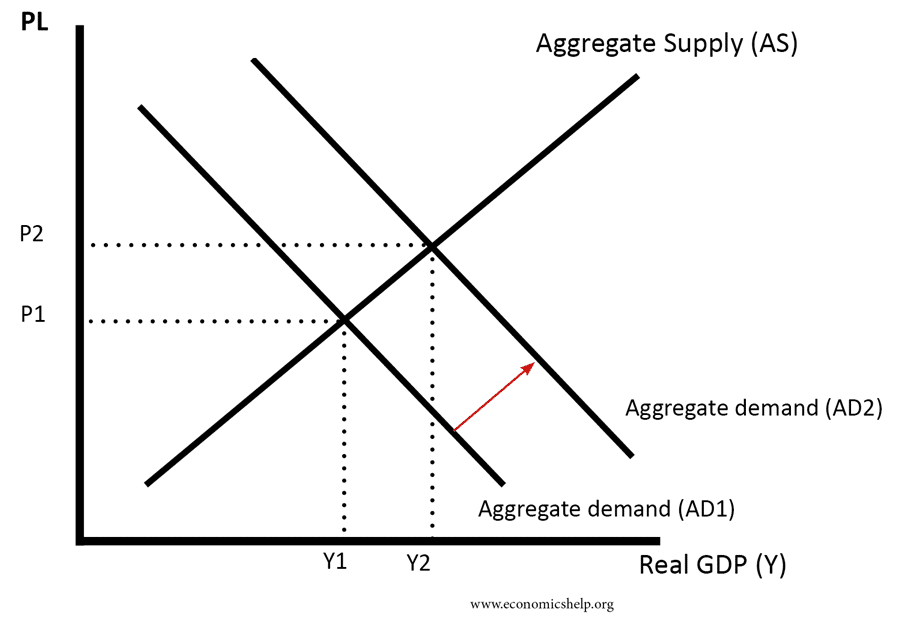
To get a visual, here is the standard chart.

Source
When the VoM is stable, the expanding monetary base pushes aggregate demand further out. With a monetary base that is expanding, inflation will result just like it did in the 1970s. Hence you go from P1 to P2 on the chart.
The situation is the opposite of what happens now. Since the VoM is declining, we are not seeing the same impact from the altering of the monetary base. Any change in the monetary base as less impact. In this scenario, the aggregate demand reverses and is pulled downward, direct opposite to the 1970s.
What we end up with is a deflationary gap where real GDP is less than what the potential is. Didn't we just see a lower than expected GDP print for the 3rd quarter? GDP does not contract when demand is strong.
Of course, this is not surprising considering the stimulus put out last year. The challenge here is that numerous studies from all over the world conclude that this activity ends up providing diminishing returns. Whether it was the ready-made projects of 2009, the Trump tax cuts, or the transfer of money to middle and lower income families, the result is the same. We get an initial hit and then it diminishes.
Economic Contraction
The deflationary gap caused by the pulling down of aggregate demand will cause economic contraction. It will result in the eventual reversing of the inflationary pressures we now see.
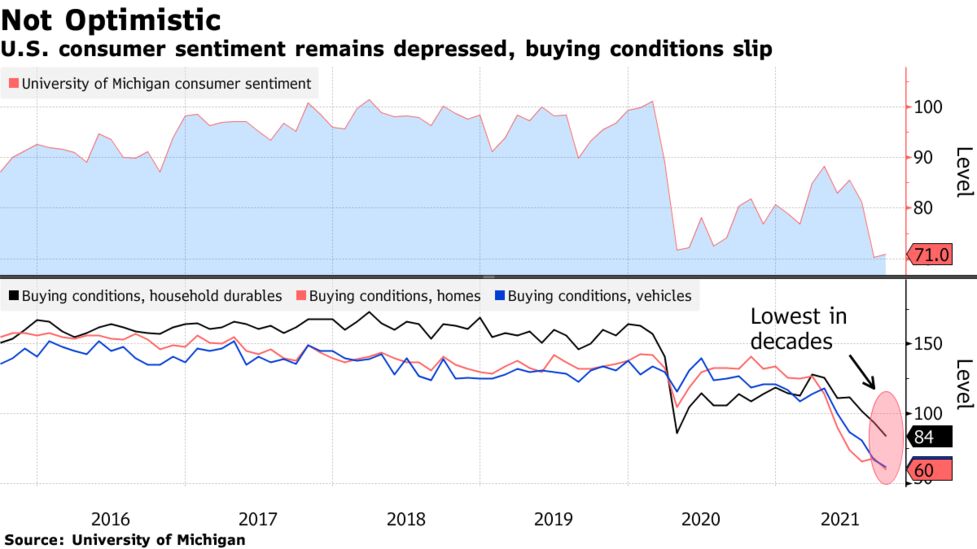
Looking at the trend from the University of Michigan Consumer Sentiment Survey, we see how things can be affected.

Source
As we can see, the consumer, at least for major purchases went home. Was it any surprise that car sales fell off a cliff in the 3rd quarter? The financial media and talking heads on television tried to sell us on a supply chain issue (chips). While that might be part of the problem, this chart shows there is a demand issue brewing. Even if automobile manufacturers were able to ship the cars to dealers, it is unlikely sales would be robust. The consumer is telling us that.
Of course, here again we see evidence exactly what the aggregate supply and demand curve tells us. In an environment of slowing VoM, the change in the monetary base has initial impact and then wanes. Now, after 18 months of stimulus, the results are horrific. The shock to the supply chain along with the resulting higher prices simply cannot be sustained. We are already seeing the demand pulled inward which is going to start pushing prices down in many categories.
We are seeing some reversals in commodities. Unfortunately, energy is on fire which also leads to higher food costs. However, that also have an impact upon other areas since, as more of the budget goes to those two areas, discretionary spending is reduced.
Nevertheless, we do see charts such as this popping up. Here is iron ore:
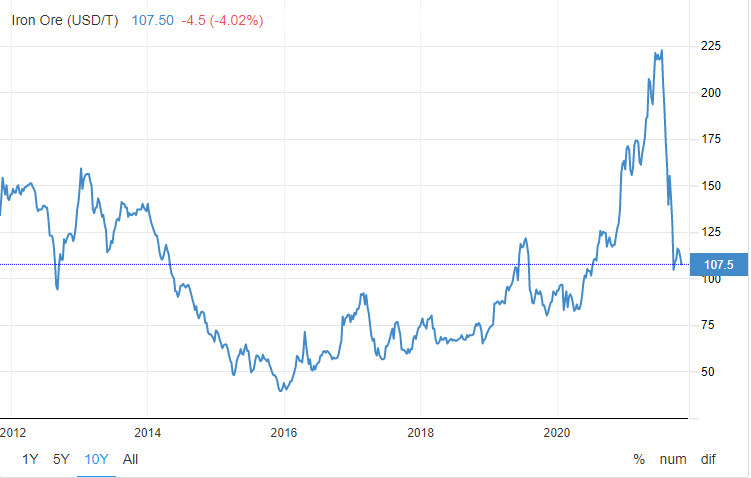
Looking at a 10 year chart, we see the bull run which started in 2016 ended up with a major run up right after the lock downs. The last 6 months saw a major pullback. A number of charts are starting to show a similar pattern. We can expect it to continue if demand further erodes.
Watch the University of Michigan Consumer Sentiment numbers for the forward looking information. That will tell you a great deal about what will be taking place.
If you found this article informative, please give an upvote and rehive.

gif by @doze

logo by @st8z
Posted Using LeoFinance Beta
You need to stake more BEER (24 staked BEER allows you to call BEER one time per day)
https://twitter.com/taskmaster4450/status/1454980507461107716
The rewards earned on this comment will go directly to the person sharing the post on Twitter as long as they are registered with @poshtoken. Sign up at https://hiveposh.com.
Congratulations @taskmaster4450le! You have completed the following achievement on the Hive blockchain and have been rewarded with new badge(s) :
You can view your badges on your board and compare yourself to others in the Ranking
If you no longer want to receive notifications, reply to this comment with the word
STOPTo support your work, I also upvoted your post!
Check out the last post from @hivebuzz:
The consumer sentiment isn't looking good but the earnings reports for some of the biggest corporations have shown that the consumers are willing to pay the higher prices. It isn't looking good at all because I foresee less people buying stuff due to the high costs and wages not keeping up.
Posted Using LeoFinance Beta
Depends upon the industry. There some, like Tesla, that excelled. Others like the legacy automakers that are going to suffer.
We will see the higher end continue to do well since it is less affected and the necessities. Yet discretionary spending tends to wane with higher prices.
Posted Using LeoFinance Beta