Bitcoin: Looking at Yearly candles Just for Fun
Hi folks, this is George and we are still in 2022. Nothing much is happening. You can take a look a this Video BTC update to learn about the complete lack and usual lack of crypto volatility during the holidays.
So, why this post then? Long story short, I was fooling around on tradingview when I stumbled into charts like this one here:
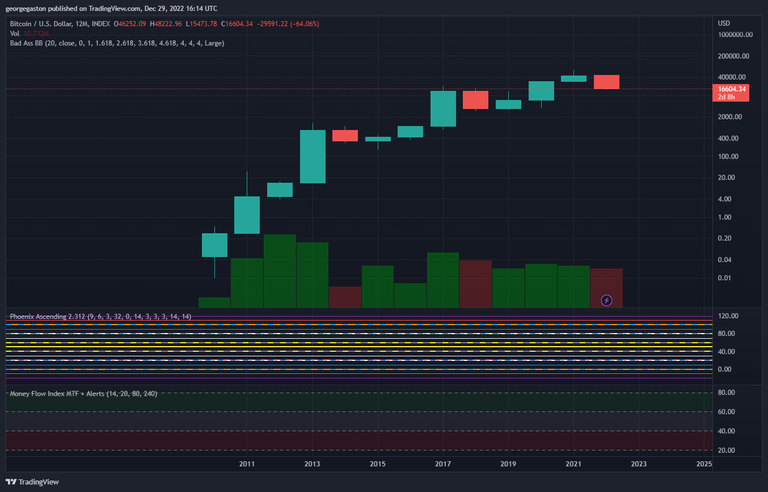
Doesn't look amazing. You can see with this yearly set up that since 2011 (and before if the chart had more data) we've been going up. The pattern is really nice to look at. 4 green candles, 1 red, 3 green, 1 red, 3 green... and then 1 red in 2022.
**What does it mean? ** Absolutely nothing. No one really use this time frame. Swing traders prefer hourly an daily, and long prefer to analyze the trend with 3 days/weekly/10 weeks/monthly time frames.
But I guess, some of us want to see a sign that 2023 could be the year. Still, odds are good that we'll see a move up in 2023, but don't hold your breath, it can happen anytime. For now, there's nothing really giving us a clear sign that things are going the other way. Bitcoin and crypto will most likely continue to follow the Stock market and the world economy before it rise up again.
Conclusion: we could see another red candle starting 2023 and the following months. Just follow the price. If you really believe those insane predictions that BTC could go up to 100 000$, what do you have to lose? A contrario, you could lose big if get in before we had confirmation of strength.
Anyway, this was just for fun and my last post on BTC for 2022. If I don't see you before, have a happy new year.
Good luck and good profits.
GGP
Disclaimer: not an expert. Not financial advice. Just for fun.