Steem Statistics
All the information presented in this report are based on the data collected from the blockchain until 2019-12-30 midnight UTC time. The goal of this report is to provide you with a clear view on what is happening daily on the Steem blockchain.
New users
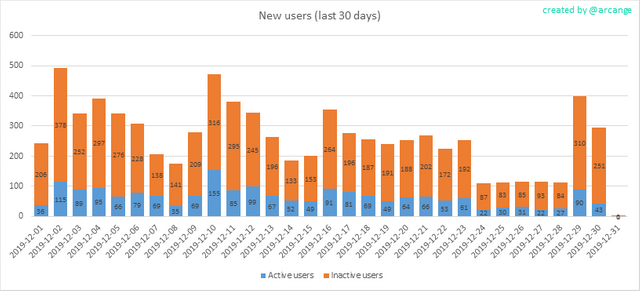
This chart shows the number of newly registered users on the blockchain and how many of them became active. We see that a lot of accounts are registered, but never used.
Warning: this graphic is kind of dynamic! A user can register one day and become active a few days later. Therefore, the number of active users on a specific date may change from day to day.
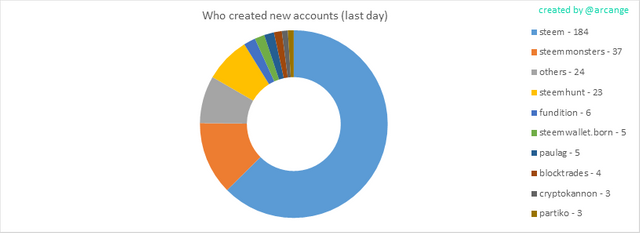
This graph shows who created new accounts during the last day.
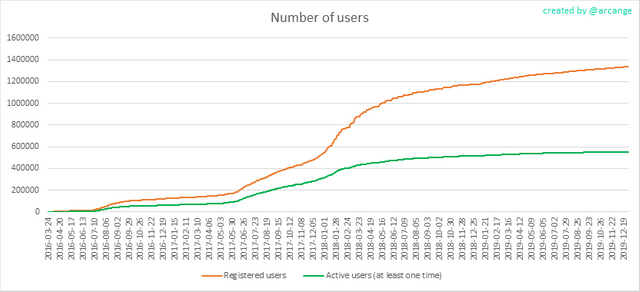
In this graph, the orange line shows the total number of registered accounts.
The green line shows how many of them have been active at least once (by active users, I mean those who made at least one post, comment or upvote). They are included even if they become inactive later.
Active users
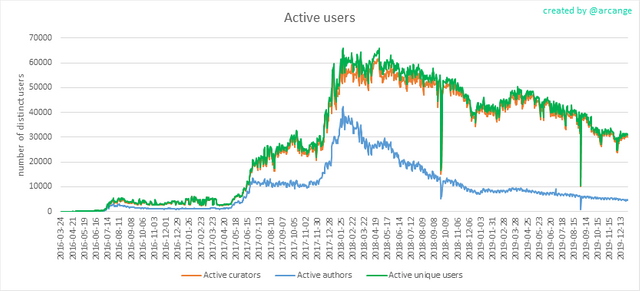
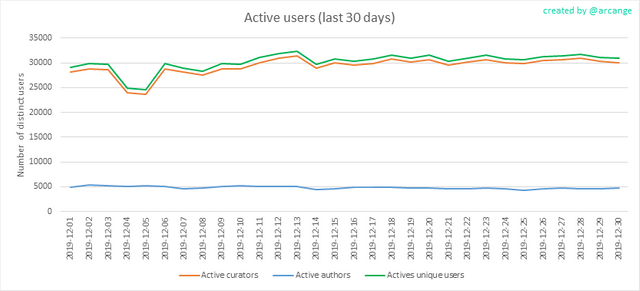
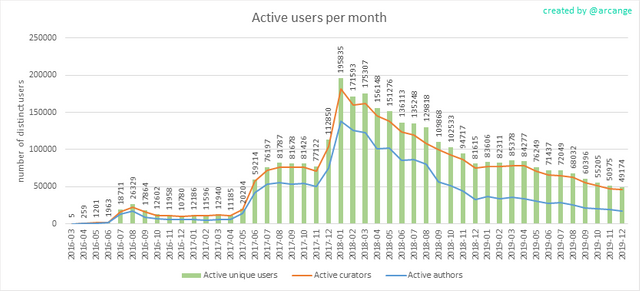
These graphs show the activity of users over time and in more details for the last 30 days. They use the same definition for active user as stated above.
The last graph is a monthly summary of the active users. It allows you to compare values from the Steem blockchain to those one usually published by other social networks.
Downvoted for plagiarism!
Sorry @arcange, maybe I won't repeat it.