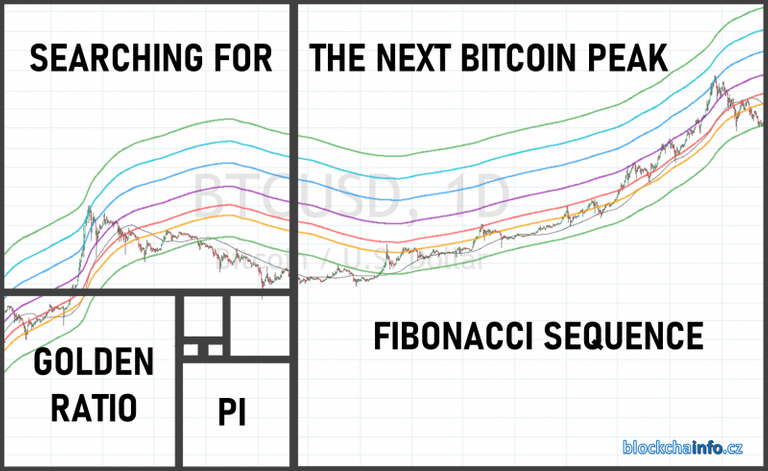
Finding the new Bitcoin ATH using mathematics
The use of universal mathematical laws in trading is not unique. These laws work not only in the entire universe and thus everywhere on earth, but also in the psychology and subconscious of humans.
That is why we can use math in finding new peak of Bitcoin price. With tools such as as golden ratio, Fibonacci sequence, Fibonacci retracement, moving averages, Pi number.
Before we dive into this, let's explain some important terms.
Golden Ratio
Golden Ratio = φ= 1 : 1,618 = 0,618
Ideal proportions of photographs, paintings, sculptures, architecture. People are looking for a golden ratio subconsciously because it is in this ratio that works best for the eye. The best-known example is the Eiffel Tower, the navel on the human body is also in golden ratio, check it out yourself.

Fibonacci sequence
It is an infinite sequence of natural numbers, where the next number is the sum of the two previous ones.
Fibonacci numbers are: 0, 1, 1, 2, 3, 5, 8, 13, 21, 34, 55, etc.
It is also interesting that the share of two consecutive members is always close to the value of the golden ratio, ie 1,618.
Fibonacci retracement
Here we already touch on the concepts known from technical analysis. Retracement according to Leonardo Fibonacci is important ratios obtained from the Fibonacci sequence. They are important supports and resistances in trading.
The most important ratios are 0,382 and 0,618
Pi
π from mathematics is the ratio of the circumference of the circle to its diameter. The value of Pi is 3,14.

Bitcoin Price Calculation with Golden Ratio Multiplier
Let's go to the interesting part. Apply these numbers to the Bitcoin price.
Since Bitcoin is more like a technology that is adopted exponentially than the stock market, it needs to be viewed as such. It is a decentralized form of money, which will be limited in quantity and for which the price increases just in line with the increase in use.
Mathematical structures and calculations can be observed even in the relatively short history of Bitcoin, for this gift from Satoshi has been with us for just over 10 years. Thanks to mathematical calculations, the peaks of the following market cycles can be revealed, as they have done so in the past.
Moving average of 350 days
The Moving Average (or MA) bitcoin price of 350 days is historically one of the most important. When the price is below this average, we are in the bear market. On the other hand, a price above 350 D MA indicates a predominance of bulls.
Moving average x Golden ratio
When we multiply the 350-day moving average (350DMA) by the specific numbers at the beginning of this article, we get the following levels. You can verify that these levels have also served as important supports and resistances in the past. Let's start with the Golden Ratio as the most important level.
Moving average x Fibonacci sequence numbers
It will be even more interesting if we substitute the lines given by a multiple of 350 DMA numbers from the Fibonacci sequence, ie 2, 3, 5, 8, 13, 21.
When you look at the chart, you will notice that in each of the previous bull markets the price bounced off the lower level of the Fibonacci sequence.
350 DMA x 21 = 2011 peak
350 DMA x 13 = 2013 peak
350 DMA x 8 = 2014 peak
350 DMA x 5 = 2017 peak
350 DMA x 3 = 2021 peak?
350 DMA x 2 = 2025 peak??
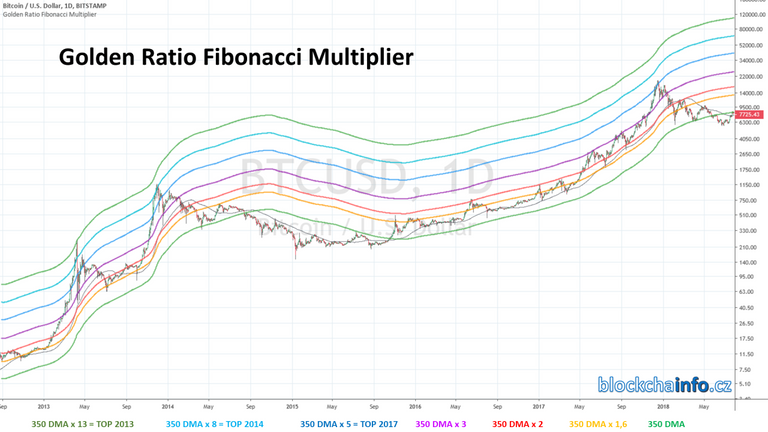
Golden Ratio Multiplier by Philip Swift
Use in trading
We know that Bitcoin is undergoing multi-year cycles due to halving the rewards of miners, as well as exaggerated optimism (FOMO) and pessimism (FUD). The 350 DMA appears to be particularly relevant to these market cycles, also due to the consideration of market psychology and crowd behaviour.
As with other indicators, the Golden Ratio Multiplier (the original name by Philip Swift) must not be used alone. It should offer the chance to improve your risk management.
An example is a previous cycle. If someone bought Bitcoin when breaking through 350 DMA and then took part of the profit at x1.6, x2 and x3, it would be a decent investment strategy.
Ideally, however, it could be sold at the very top of the market when the price touched 350 DMA x5.
Indicators that can act as supports are shown in grey. In contrast to the above, 350 DMA is divided by Fibonacci sequence numbers.
As long as the peaks of the Bitcoin market cycle continue to follow this strategy or system, the next peak of the Bitcoin market cycle could be the three times the price of 350 DMA (purple line).
Pi and its use in finding the next Bitcoin ATH
You will get this great tool to find the next peak of Bitcoin, when you combine 111-day moving average with 350 DMA x2 in the graph.
When 111 DMA rises above 350D MA x2, the price of Bitcoin will peak in its market cycle. This has always happened in the last three cycles, with an accuracy of + - 3 days!
And why exactly 350 and 111? When you divide these two numbers, you get 3,153, the number very close to Pi (3,142).
So, in the next bull market and especially in the parabolic growth of Bitcoin, watch this level.
Surely, we have just 3 cycles to measure and put to the statistics, that is not the best amount for decent results. This doesn’t mean that this will happen exactly for 100%, as nothing in trading is for sure. But it’s not a bad strategy to consider this at least.
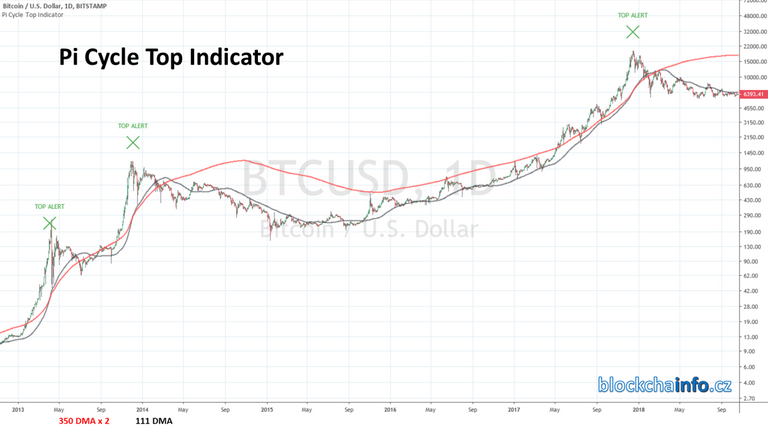
Pi Cycle Top indicator by Philip Swift
Final summary
The Golden Ratio Multiplier will be a useful investment tool in the upcoming Bitcoin market cycle for identifying profit areas. When the price is close to multiples of x1.6, x2 and x3, there can be found ideal exit points for your investment. Of course, the distribution is subject to your risk management.
The peak should touch the level of 3x 350 DMA. If you also use the Pi indicator, you can find the peak of the current Bitcoin cycle.
Very fascinating about all of this is an evidence of how the adoption of Bitcoins and cryptocurrencies is guided by mathematical patterns that occur everywhere in nature and throughout the universe.
Discoverer of Golden Ratio Multiplier and Pi indicator is Philip Swift, which you can follow on Twitter. His scripts can be found at lookintobitcoin.com or at TradingView.
Past price behavior cannot be automatically applied to the future. A lot of predictions of the renowned traders come across this lesson.
However, it is good to be aware of these price behavior patterns and should be applied in your strategy. Everything is necessary to form your own opinion.
On the other hand, the more these calculations and indicators are known, the more likely the future will look different than Philip Swift's mathematical formulas.
If you want to use these tools in your TradingView, here I offer you instructions for their implementation for free - here.
Source: The Golden Ratio Multiplier article by Philip Swift
Photo source: Pixabay, Wikipedia
Graphs made in: TradingView
What do you think about Golden Ratio Multiplier and Pi Cycle Top Indicator? Do you like the theory or not? Do you think they can work properly in the future? Can the past results being used for calculating the future ones?
@blockchainfo has set 3.000 STEEM bounty on this post!

Bounties let you earn rewards without the need for Steem Power. Go here to learn how bounties work.
Earn the bounty by commenting what you think the bounty creator wants to know from you.
Find more bounties here and become a bounty hunter.
Happy Rewards Hunting!
Congratulations to the following winner(s) of the bounty!
Find more bounties here and become a bounty hunter.
Find more bounties here and become a bounty hunter.
Find more bounties here and become a bounty hunter.
Find more bounties here and become a bounty hunter.
Find more bounties here and become a bounty hunter.
Find more bounties here and become a bounty hunter.
It is very interesting the use of the Golden Rule for the crediting of market behavior, I had not seen it before in this way, I appreciate that, because it makes me think.
I am struck by the fact that I have seen several price predictions of the BTC that point to an increase in 2020, but in your study, you rather point out that a rise in 2021 may occur, it is not far off, but it still arouses curiosity.
I share the idea that the past can be used to anticipate future behaviors, but not for a "precise prediction", after all, for the analysis of events and the development of potential scenarios there is an overwhelming amount of variables that can intervene.
Perhaps because of this, the large number of variables and the wide range of values that they can present, the implementation of Data Mining, Expert Systems and more recently AI for market analysis, has been seen as a set of tools with which it is necessary get acquainted
I wonder what it would be to combine this interpretation proposal based on the Golden Rule and the Fibonacci sequence with an AI ... I have no clear idea what would come out, but I don't doubt it would be interesting.
Hi @pedrobrito2004, thanx for your reply.
I point out 2021 and 2025 as a next peak years simply because of my understanding of the market. It can be in 2020 and then whenever, but I think if the cycles are repeating every 4 years, that means the main cycles were 2013 and 2017, that makes me those years.
Surely, it can be calculated for the entries that way and after next peak, maybe someone else will come with the theory that 400 D EMA + 127 D EMA are better for finding the next peak, that is possible. But at this moment, it seems to me very fascinating to look at it that way, using golden ratio multiplier for moving averages. I will watch the levels closely in the next bull run.
Resteemed and upvoted @blockchainfo :)
Thank you so much :)
Dear @blockchainfo
Would you mind if I take few minutes of your time?
Together with few core members of project.hope team - we'te trying to promote our recent publication: an article explaining economy behind our non-profit community project build on STEEM blockchain.
Perhaps I could ask you to spare few minutes and check it out and share your feedback with me.
I would absolutely appreciate it a lot. I read all comments and I drop solid upvote on each valuable one.
Link: https://steemit.com/hive-175254/@project.hope/3-ways-of-joining-our-efforts-project-hope-economy-explained
ps.2.
HAPPY NEW YEAR :) Hopefully 2020 won't be as scary as many expert are predicting.
Cheers,
@crypto.piotr
Kinda felt weird looking at the DOW recently. We are overdue for a correction. Seems as if BTC and traditional markets are gearing up to go their separate ways for a spell.
Hi @machnbirdsparo, I think that the US indexes and stocks are coming for next ATH´s at this moment and do you know why? Because of the lowering interest rates and FED throwing created money on banks. The inflation (amount money in circulation) is increasing, so most of those will go to the stocks and a few to crypto I guess also.
I do agree that the run up will continue for a bit (at least). Just wanted to keep an eye for any holiday panic.
Hello,
Your post has been manually curated by a @stem.steem curator.
We are dedicated to supporting great content, like yours on the STEMGeeks tribe.
Please join us on discord.
Thank you
I like the theory but I don't think the success rate would come close to 70%
Posted using Partiko Android
Hi @fredkese, yes I also like it, because it simply sound optimistic, if it would be true (for 100%). It might not, but definetely it should be considered in the trading positions I guess. Thanx for stopping by.
@blockchainfo, I have to accept that you've gave very diversified meaning to life and it's Calculation.
Everything runs on Universal Law and Calculations without any doubt. Really want appreciate this kind of thought opening blog.
Now Bitcoin became Daily Ingredient for many.
Have a great time ahead and stay blessed.
Thank you for your reply, glad to got your attention on this amazing topic! Stay blessed @chireerocks
Welcome and thank you so much.
Posted using Partiko Android
Dear @blockchainfo
It's definelty interesting read. I'm not much of a trader (burned myself doing that). However I kind of learned not to believe in maths when market is very small, with almost no liquidity and easy to manipulate with mass media news.
Math surely is working everywhere on earth. The only thing is that same math is being used against traders and following indicators does remind of being a sheep.
I think it's much easier and more efficient to monitor and measure moods of traders and investors. Comparing to monitoring indicators and following predictions.
Upovted already,
Yours, Piotr
Hi @crypto.piotr, most of the traders are in red numbers, so it is actually not a bad thing, that you are not one of them.
In one of the next interviews we will have someone experienced with what you are talking about - measuring moods of traders and the crowd. It is surely a good way how to look upon the market. But this indicators mentioned in this article "could" be a perfect tool, when used properly, to find the top/resistances/supports, which is not 100% of course, but it might help.
Thanx for your reaction!
Thank you for your comment @blockchainfo and for being so responsive
Looking forward to see that interview.
ps.
I hope you don't mind that I would invite you to check out my latest post: FINALLY IT'S TIME TO INTRODUCE MYSELF AND SHARE MY VISION AND GOALS.
After 1.5 year on steemit, I decided to share my goals and vision and I'm interested with any feedback I can receive.
Yours
Piotr
I don't want to be rude just sharing my opinion.
I love that you're so positive about this but we all know that it's hard to believe that the situation of this will be consistent.
Posted using Partiko Android
You got the point, surely. It might be just "overcalculated" from the past, I am not saying it is not. But its worth considering that it might work "for us" if the peak will be closer and closer. Have a good day!