How To Interpret Your Web Tracker Stats Like a Pro
Glad you're here reading this!
In my last training on using web trackers I discussed LeadsLeap, a great link tracker that helps you understand who is sending you traffic and where your conversions are coming from.
LeadsLeap isn't specifically a tracking service, but their tracker is excellent, and should be used by anyone wanting to track their results. I use their service everyday for my primary business. They're a solid advertising platform. Use this link if LeadsLeap is something you'd like to check out, and yes, I track it. :)
Today we're going to look at the statistics found in LeadsLeap, and how you can really dive in and determine your best traffic sources.
Free Special Tool for all my Subscribers.
If you're one of my sign-ups to Rob's Marketing Tips, then I've got a special tool for you to use as well.
In the Rob's Marketing Tips Extras for my subscribers, there's a spreadsheet called LeadsLeap-Tracking-Spreadsheet saved in both .xlxs (Microsoft Excel) and .ods (Libre Office) format. Be sure to download your copy, and follow along in my video. :)
You'll see me covering this handy tool in the video above. Let's get started!
LeadsLeap Stats Breakdown
Let's go step-by-step and walk through the different statistics that are available on Tracked Links and Rotators.
By the end of this tutorial, you'll have a solid grasp on the stats that are available and how to effectively leverage LeadsLeap to promote your site or offer.
Ready? Let's go!
Login to LeadsLeap and go to the Tracker Tool.
Rotator and Track Links have the same stats.
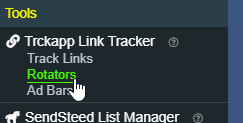
Login to LeadsLeap. Once logged in, on the left under Tools > TrckApp Link Tracker, click Track Links or Rotators depending on which you're interested in.
For this example, I am going to be using one of my successful Rotators, which gives me stats on two nearly identical Lead Capture Pages that I'm rotating.
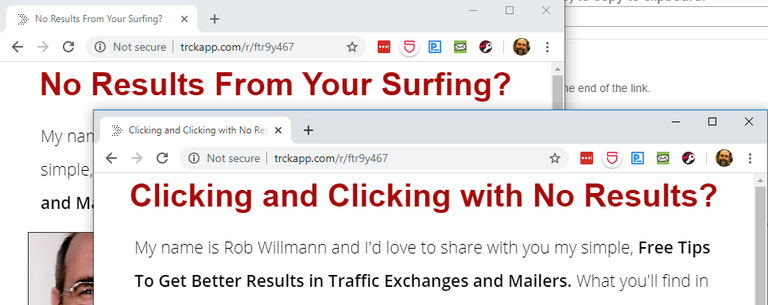
These two lead capture pages are identical, except for the headlines.
They're both Lead Capture Pages at ClickTrackProfit. Each page is identical except for the headline. Otherwise they're the same.
Side note: ClickTrackProfit is a great site for affiliate training, and high recommended.
Pro Tip: When developing ads, create a few different headlines for your ad. Use a rotator and rotate through the ads. Make sure everything else is the same except for the headlines.
Then track the results. After a few thousands hits, you'll know which ad works the best. Keep the one with the best conversion rate, and dump the rest.
-Rob
Totals, Uniques, and Reals, Oh My!
The Initials Summary Stats You'll See.
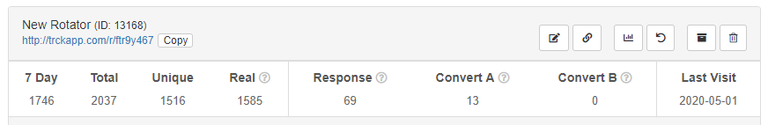
Let's dive in and take a look at the stats on my rotator example
- 7 Day
That's the raw total hits received over the past 7 days for the link in question. - Total
Just like it sounds.... this is the raw total number of hits that have been tracked by this LeadsLeap Tracker URL. In my case, it's around 2,000 hits. - Unique
Over the time-period selected, this stat is the number of unique hits to my rotator. Notice this number is significantly lower than the total. That's because the tracker discards multiple visits by the same visitor. - Real
LeadsLeap defines this stat as: "Total Clicks That Stay More Than 5 Seconds (Clicks that stay less than 5 seconds are usually clicks from robots, spiders, or clickers who do not really visit the site.)" - Response
A count of hits where the visitor has performed an action of some type on the page. Examples:- clicking on a link,
- filling out a form,
- playing a video, etc.
- In other words, your visitor did SOMETHING.
- Convert A
Total Visits that Result in a Conversion. More on this shortly. - Convert B
Total Visits that Result in Another Conversion. For example, Convert A could track visitors who fill out your opt-in form and land on your Thank You page, and Convert B could be the same user who then purchases something from your Thank You page link and ends up on a shopping cart or purchase page. Two levels of tracking conversions! - Last Visit
The date the last visit to the tracker was recorded.
What I am most interested in as a marketer is which sources give me the highest percentage of conversions. That's not a stat that comes with LeadsLeap out of the box, but it's a snap to figure out.
How Does LeadsLeap Know About Sign-Up Conversions?
LeadsLeap includes the ability to track who signs up (or converts) from a lead capture page. Enabling this option is relatively straightforward.
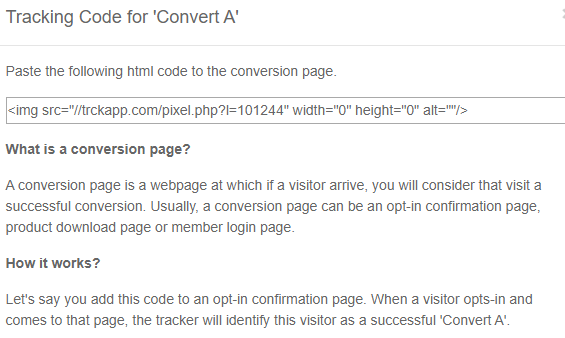
In the screenshot above, you can see the actual tracking code I use on one of my lead capture pages. In essence it works like this:
- A visitor comes by your site and reads your offer. Since you're using the LeadsLeap tracker, that counts as a 'real' visit. :)
- Assume the visitor likes your offer, and enters their name and email and clicks the button to sign up.
- At that point, LeadsLeap will also increment the tracking counter for Response, since the user took action on the page.
- Next the user is redirected to your Thank You page. Since your Thank You page also has the conversion tracking code on it, LeadsLeap is able to determine the visitor landed on your Thank You page and increments the Convert A statistic. Neat!
Once configured, all the magic happens in the background. All you need to worry about is your Conversion Percentage. More on this in a bit. :)
Start with The Detailed Stats
While those initial stats are great, the real win is with the detailed stats. Click the detailed stats button to drill in.
First things first - adjust your Time Period.
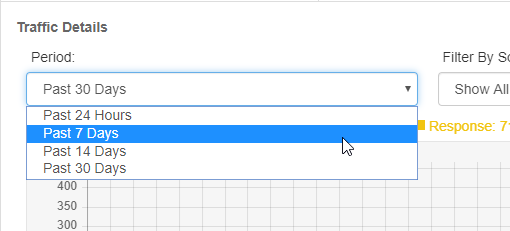
You can adjust the timeline of you chart by adjusting the period.
In my example video, I'm only concerned with the last 7 Days worth of stats since my tracker has only been tracking for approximately 7 days.
From the Period dropdown, there's a few options to choose from:
- Past 24 Hours,
- Past 7 Days,
- Past 14 Days,
- Past 30 Days.
Select the granularity you need to see, and LeadsLeap will modify the chart to fit the appropriate time-window.
For our example, I'll be looking at a 7 day period.
Understanding the Line Graph and Bar Graph on the Same Chart
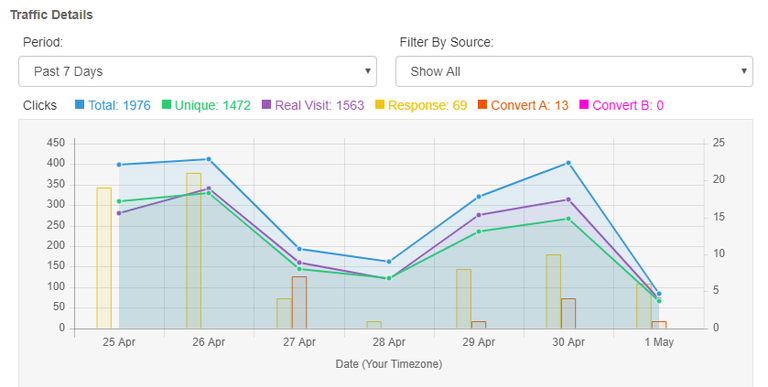
The lines on the chart use the left Y-Axis and display Total, Unique, and Real. The Bar graphs on the chart represents Response, Convert A, and Convert B. The Bar graphs use the right Y-Axis.
In the screenshot example, you can see I've selected Past 7 Days. Notice that there are two Y-Axis scales on the chart with different numbers. One is on the left, and the other is on the right.
The left-side Y-Axis scale in my example shows 0 through 450, and the right Y-Axis scale shows 0 through 25. There are two scales on the same chart because the left Y-Axis scale is for the lines on the chart, which show Total, Unique, and Real plot points.
The right Y-Axis scale shows 0 through 25, and is used for the bar graph of Response and Conversions. Easy. I explain this in the video as well.
This really allows you to take a look at the stats per day and the number of conversions seen each day, all on a single chart.
Surf Duration - How Long Visitors Were On Your Page.
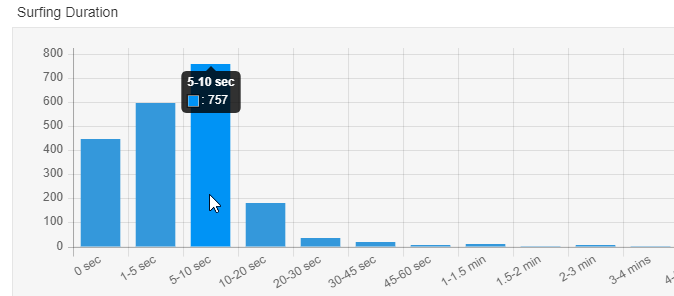
5-10 second duration appears to be the largest group of visitors in my example. Not too bad considering I was using Traffic Exchanges and Mailers to drive visitors to my capture pages.
I really like the LeadsLeap stats because I can see how long visitors were on my site. Fancy!
Just below the Traffic Details is the Surf Duration graph (screenshot above.). This is helpful because it breaks down the surfer duration into groupsins of 0 seconds, 1-5 seconds, 5-10 seconds, 10-20 seconds, etc.
This really helps, especially when you are able to use the Source drop-down and select a specific source. You can use this method to find sources with small surf durations. such as 0 seconds or 1-5 seconds.
Remember, the longer the visitor is on your page, the longer they have to digest your offer and make a decision.
Since I use traffic exchanges and mailers for a large part of my free traffic, I expect to see some shorter duration times on this chart.
In the example above, I am at 5-10 seconds for the largest percentage of my visitors which is acceptable to me. My Lead Capture Pages are short, and that is enough time for someone to decide if they are going to enter their email address and name into the form.
Stats By Source is my Favorite Metric.
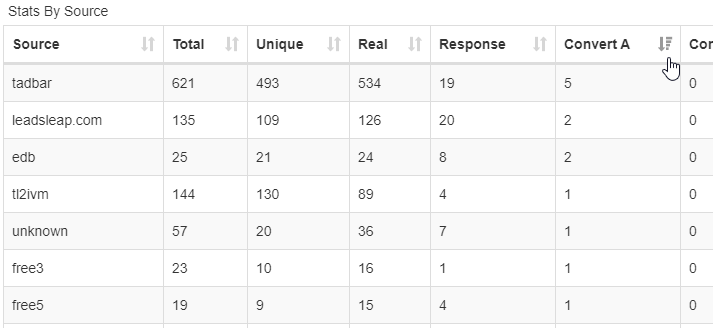
Not all sources are created equal. Spend some time looking at your "Stats By source"
This is where LeadsLeap really shines. Not only can I see how many visitors I receive per source, but the LeadsLeap Stats By Source data also gives me the Response and Conversion stats. Wonderful.
Before I discuss the details, take a look at the screenshot above.
Sort by Conversions (Or any OTHER Metric).
Notice that the cursor\hand icon in my screenshot is just below the sort icon in the Convert A column.
By clicking this icon, you can sort your source data by ANY of those column headers.
This means you can sort by the Source Name for an alphabetic list, or you can sort by Response or Conversion.
In my example, I am sorting by Conversion so I can get the list of sources who gave me the most email sign-ups. That's the real win here.
You can use these simple techniques to drill in and get the number of Conversions Per Source.
There's one metric that's missing, and a relatively easy way to fix it. Keep reading. :)
What is Response Percentage and Why Does it Matters?

Using my Spreadsheet Tool I can add two Additional Metrics to help me make my advertising decisions. Awww yissss.....
It's great that LeadsLeap gives you the Real visitors per source, and the Response count per source. But what about the Response Percentage?
Unfortunately, that's not one of the stats that's immediately available in LeadsLeap. Yet it's super easy to figure out yourself.
The formula for Response percentage is:
(Response / Real) x 100.
By dividing the Response count by the total number of Real visitors, and multiplying that by 100, I can calculate the Response Percentage. This is the percentage of the traffic that actually took some sort of action on the page.
This is important. When reviewing your stats, it's not so much the count that matters, it's the percentage. I'll cover this in a moment. Right now, let's talk about Conversions.
Conversion Percentage is the Most Important Stat. Period.
8.33% Conversion Rate is fantastic.
If I am sending my traffic to a Lead Capture Page where potential visitors can sign up for my newsletter, this is the start of my relationship with the visitor.
Sure, web traffic is great, but if the visitor leaves without doing anything, I have no way of contacting them or reaching out again.
By using a Lead Capture Page, I can start a marketing funnel, and build a relationship with my visitors.
Visitors come by my site, they fill out the form, and now I have a way to reach back out to them. Simple.
What's needed is a way to determine which advertising method, (traffic exchange, mailer, etc.) gave me the most sign-ups.
This is especially important if your business relies on leads, like mine does.
Therefore I calculate the Conversion Percentage, just like the Response Percentage. The formula for Conversion Percentage is:
(Convert A / Real) x 100.
Use My Free Spreadsheet Tool to Automatically Calculate the Stats You Need.
I'm lazy by nature and will spend time making a tool if it will save me time in the future.
Since LeadsLeap doesn't automatically provide Response Percentage or Conversion Percentage, I made a spreadsheet that helps me do it.
Sure, I could use my calculator every time, but that's prone to user-error. If I mess up my calculation by hand, I could make the wrong marketing decision.
Copy\Paste Your Stats into your Spreadsheet Tool for More Insight.
Instead of calculating those stats by hand, I copy the data from LeadsLeap's stats and paste them right into my spreadsheet.
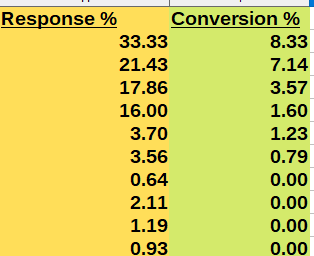
Let's take a look at my stats now that I've calculated it as a percentage.
Elite Downline Builder (EDB) is the #1 source that gave me the greatest number of conversions for the fewest number of visitors. That's impressive.
I won't get into the math of statistical significance, but boiled down, remember that the more traffic you send to a tracked link, the more accurage your calculations can be because you're dealing with a larger 'pool of data'.
Feel free to download the spreadsheet from my Subscriber vistor's area as a freebie and use it to calculate the stats you need. Check your email.
What can I do To help you Succeed with Your Link Tracking?
That's it for today's training.
I hope the video, spreadsheet tool, and this article have helped you understand how to use the stats that come from LeadsLeap. These small tweaks mean all the difference with getting the last bit of performance out of your marketing efforts.
I'd love to hear from you. Please leave me a comment below with any questions, or ideas on how I can help you improve your web tracking.
-Rob
P.S. If you want to use the spreadsheets I provide my subscribers to Rob's Marketing Tips, check your email after you subscribe.
This was a great video Rob. Very informative. Thanks for sharing
Thanks for your input. I am rather passionate about LeadsLeap, and want people to see the power of using it. I get sign ups for my mailing list every day from LeadsLeap.
Thanks -Rob
Great explain and i can wait to see how that will go for me