The Fight between Bulls and Bears in Bitcoin
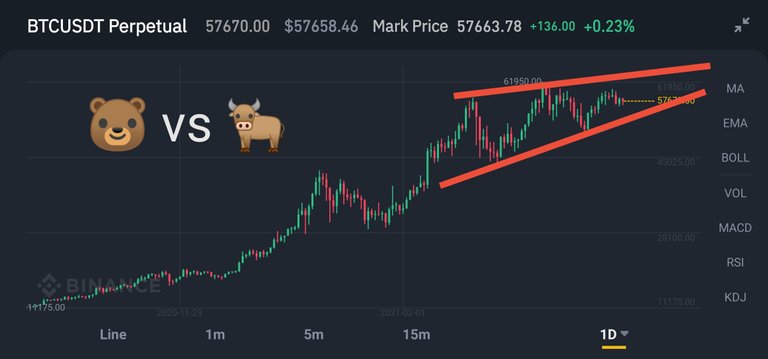
The daily chart and the bearish flag
The chart in bitcoin is very difficult to interpret at the moment. The uptrend is fully intact and the important lows have not been broken yet. We can rather see an upward correction and this has formed a bearish flag. The expired gains are likely to be very tightly hedged and a technical correction is just around the corner. However, as long as many are willing to buy even at highs, the party will continue.
The rally feeds the rally is a famous saying and that should probably be true here. A breakout on the upside of the bearish flag is also possible. However, if we fall below the lower trend line, then a technical correction is likely.
Maybe the PG on the 6 hour chart will make a decision. The price of one bitcoin has fallen in the last few hours and maybe that was just the beginning.
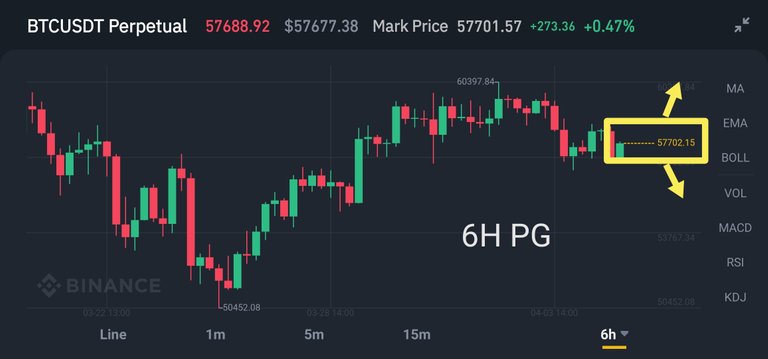
| PG | Trigger upside | Trigger downsinde |
|---|---|---|
| 6H PG | 58450$ | 56881$ |
Source: (Guidants/Godmode Trader) & JFD Broker & Binance
Discord Channel: https://discord.gg/j5A3CUq
Twitter: https://mobile.twitter.com
Legal Disclaimer:
I am not a financial advisor
nor is any content in this article presented
as financial advice. Never invest more
than what you can afford to lose.
This post is my personal opinion,
do your own research before making any investment decisions.
If you make any trades after reading this post,
it is completely in your responsibility.
I am not responsible for any of your losses.
By reading this post you acknowledge and accept that.

Posted Using LeoFinance Beta
0
0
0.000
https://twitter.com/TraderOut/status/1379052046968619024
I feel $100K Bitcoin is coming this year
Posted Using LeoFinance Beta
I think it is highly possible and when that happens we in for unstoppable bullish run!
Posted Using LeoFinance Beta
100K sounds like the next big round number
Posted Using LeoFinance Beta
It is an absolutely odd chart isn't it. Amazing though, I wonder if it will breach, April is usually a lul in the marker too
Posted Using LeoFinance Beta
The chart is a single movement and this movement ends sooner or later. For me, it will only become interesting again when the first large profit-taking has taken place. Thanks for your Dolphin Splash
Posted Using LeoFinance Beta
Congratulations this post has received a Dolphin Splash!
100% upvoted