I continue to advance and learn about Technical Analysis making a bite-sized summary each time. This is part 11 and it's best to understand what I've written down in previous parts as this build upon those.
Previous Technical Analysis Lessons
Technical Analysis #01 | Basics
Technical Analysis #02 | Trends
Technical Analysis #03 | Bearish Patterns
Technical Analysis #04 | Bullish Patterns
Technical Analysis #05 | Symmetrical Triangles
Technical Analysis #06 | Volume Indicator
Technical Analysis #07 | Moving Averages
Technical Analysis #08 | MACD
Technical Analysis #09 | RSI
Technical Analysis #10 | Fibonacci Retracements
#11 Candlestick Patterns
I covered the basics on Candlestick charts and how to read them in
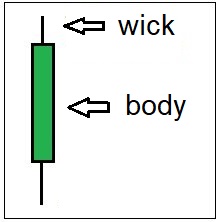
#1 Basics. Important to know is that candlesticks have a body and a wick. These pretty much show if the bulls or the bears are in control.
- Long Greed Body = Bullish
- Long Red Body = Bearish
- Long Bottom wick = Bullish
- Longs Top Wick = Bearish
A series of different candlesticks can show a bullish or bearish scenario and indicate entry prices to take a long or a short position. Candlestick patterns should always be used on top of more fundamental indicators like trend and price. Some or of the most common candlestick patterns are...
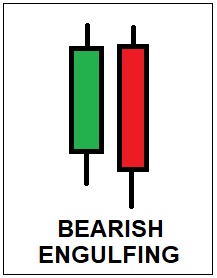
BULLISH & BEARISH ENGULFING
The Bullish Engulfing is a pattern of 2 candlesticks were are bearish red candlestick gets rejected by bulls who stepped in and pushed the price up again with a green candlestick that rises above where the previous candlestick started. Example (image Below) Looking at the price of Bitcoin on the weekly chart, the price was above the 10 week EMA meaning there was a bullish momentum. (See
#2 Trends &
#7 Moving Averages) on occasion 1 & 2 the candlesticks showed a bullish Engulfing patters right at the 10 EMA where bulls stepped in. These were 2 bullish signs that played out. On the 3rd occasion, there was also a bullish engulfing pattern but the bullish support on the 10EMA started to fail so overall conditions were not optimal and it did fail.

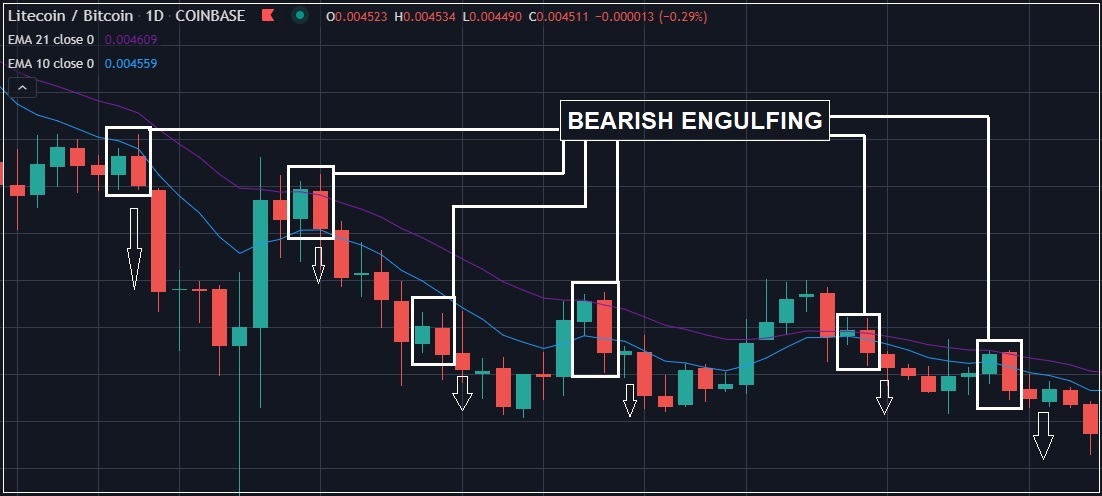
The Bearish Engulfing pattern is basically the exact opposite. Bears reject the bullish candle and the body of the red candle goes lower to where the price started in the previous candle indicating a bearish continuation. Example (Image Below). Litecoin has been in a downtrend ranging below the moving averages. There have been multiple bearish engulfing candlestick patterns which all indicated a further downside that showed to be quite effective.
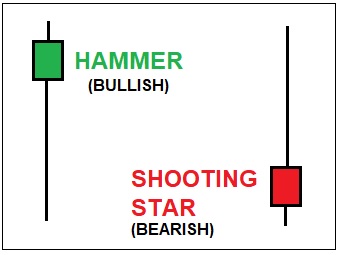
HAMMER & SHOOTING STAR
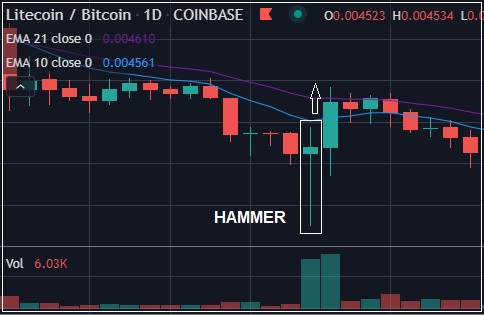
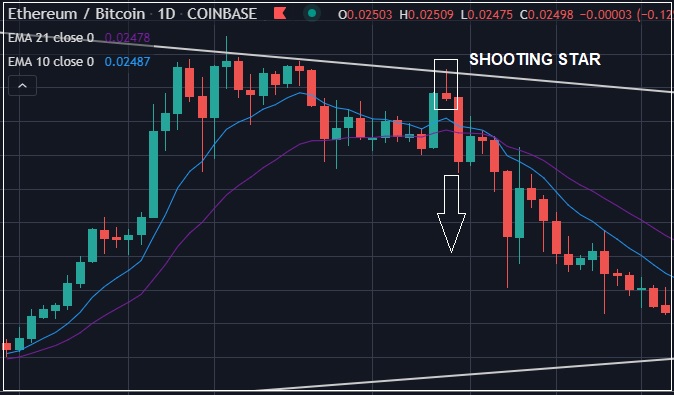
Both the Hammer & the Shooting Star are single candlestick patterns. The Hammer indicates that bears pushed the price down but got rejected by the bulls creating a long wick with a small green body of the candlestick. The Shooting Start is the exact opposite where the bulls got rejected by the bears who pushed the price way down again creating a long wick on the top with a small read body.
Example 1: Litecoin was in a bearish trend and saw a capitulation to the downside which was rejected by bulls who came in with high volume. With the price still ranging below the moving averages, there was still room to move up. The price saw a +10% increase in the next candle leaning on the 21-day EMA.
Example 2: Ethereum was in a transition from being in an uptrend to a downtrend and saw a bearish Shooting Star candlestick which had its top just at the longer-term resistance line. This gave a bearish indication and was followed by further downside with the price trending back below the moving averages.
Example 1 (Hammer):
Example 2 (Shooting Star):
MORE CANDLESTICK PATTERNS
There are many more candlestick patterns and you can easily find a cheat sheet on them when searching on google (Link). The most important thing is to understand the reasoning behind these patterns. I might make a follow-up post similar to this one breaking down more of these patterns with examples. Candlestick patterns similar to all Technical Analysis are not exact science and don't have a 100% hit rate. They do however give some strong indications and are more likely to deliver when on good setups.
Future Articles in this series
Publish0x | Costanza Technical Analysis
Posted Using LeoFinance


Technical Analysis is not really hard if you put your mind to it. Trading is what is complex. The psychology, the emotions and discipline but it's not something you can't do. Just master yourself and you'd be a pro!
By the way, let me add a few more candlestick patterns.
There's Piercing Pattern - Bullish
There's also Dark Cloud Cover - Bearish.
We also have Tweezers too.
Thanks, I'm still having a look at all the others, I'm used to sports betting so I should have a good foundation to be quite stable emotionally when it comes down to trading. I'll be putting into practice a lot more what I've learned so far and I guess that is where the real progress and lessons will be.