Types of Graphics.
There are several types of graphs but I will start with the concept of what is a graph?
It is a type of data representation, generally quantitative, through virtual resources, so that the mathematical relationship or statistical correlation between them is visually manifested.
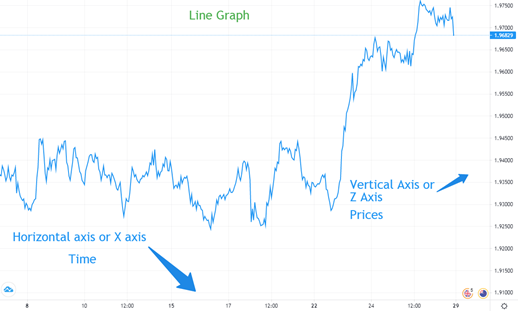
Linear graph.
It is made up of a series of data represented by points, joined by linear segments. Using this graph, you can quickly check the trend change of the data.
It consists of two axes perpendicular to each other. The horizontal axis (X-axis) that denotes time, and the vertical axis (Y-axis) that denotes prices.
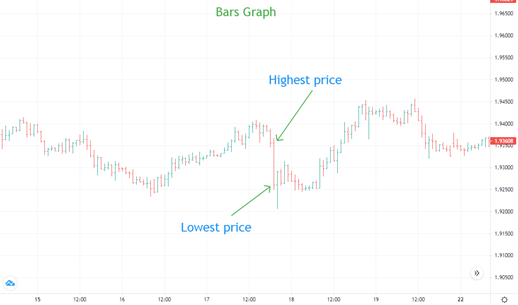
Bar graphic.
It is able to show the opening and closing prices, as well as the highs and lows of the price. The area below the vertical bar, tells us the lowest price in that period of time, while the area above the bar is indicates the price that is higher.
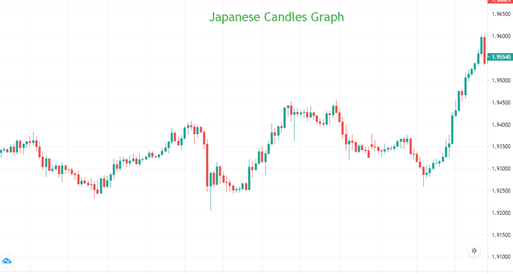
Japanese Candle Chart.
This graph offers us information about the price of a share or other products quoted in the market, it also shows us four prices in the same figure.
This chart is the most used in forex.
Heikin Ashi chart.
It is a type of chart similar to that of Japanese candlesticks, with the difference that in this one the ease of mastering the following of trends is dominated, in the forex term, it would be said that the Heikin Ashi candlestick chart reduces or eliminates noise .
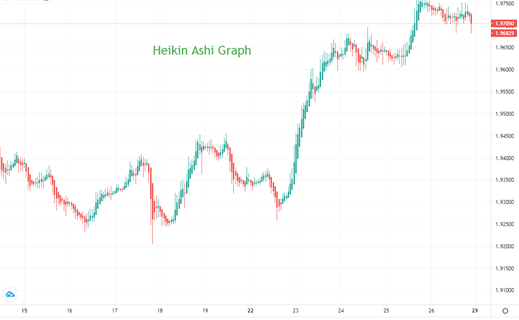
These are the most used charts in trading. Those of Japanese Candles and those of Heikin Ashi are the most complex, and then I will make a post giving their explanation.
Posted Using LeoFinance Beta