Why Markets Did Not Crash? - Trading Journal (11.04.20)
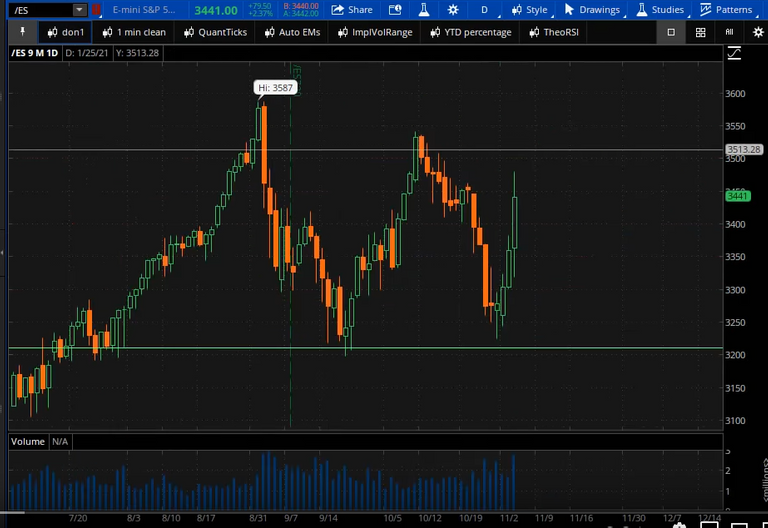
After today the /ES futures are less than 200 points from all time highs. The October down trend has almost been erased and as of now they have tacked on another 25 points in after hours trading. The sentiment appears to be very positive whether it is because of a Biden lead or because the election has moved on and now traders and investors feel a little relief. Hence all this is a relief rally.
Traders were Too Bearish?
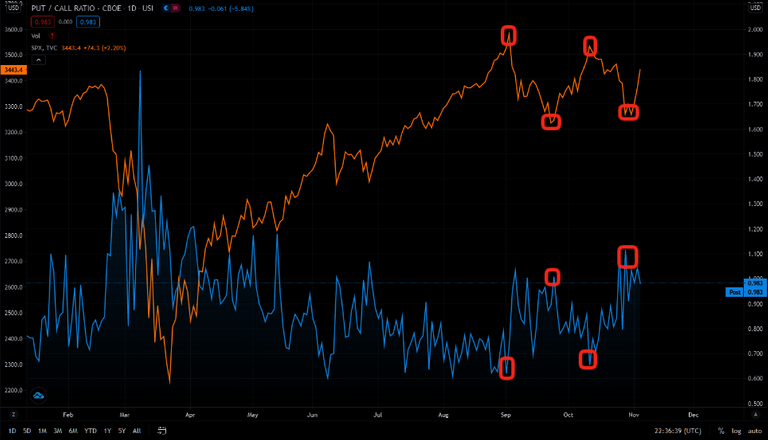
The index put to call ratio $CPCI entering into the election was at a high relative to SPY price range. Right near the end of September was the last bottom and as of end of last week SPY held that bottom price range again. What was also similar was the put to call ratio was higher right before the election than in September.
With a lot of hedges based on put contracts the more likely outcome was a rise in index prices. The people sentiment was out in the open and all we have to do was find it through data points.
Continue Buying Indefinitely?
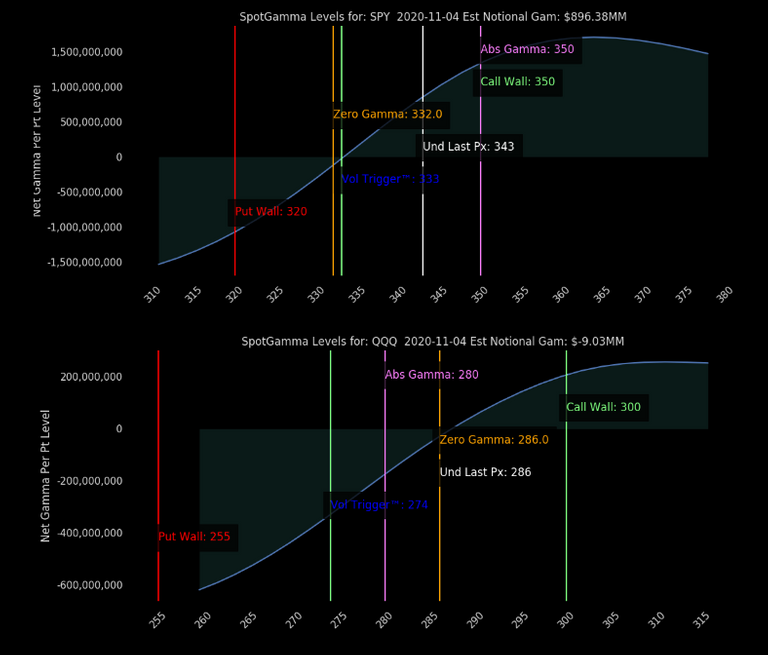
A lot of traders are reading and hearing the options trades have become popular. The gamma brought through with these contracts is basically fuel to push or pull market underline asset prices. The quick pull to the upside on the index prices in today's trading has made gamma positive. This in turn means market makers are being forced to buy more shares to hedge against their call selling. The SPY over 332 and the QQQ over 286 is the starting line for this positive gamma. As price rises over these values the market makers who likely hold most of the sell sides of the call strikes above 332 and 286 respectively, there will be more buying from market makers to keep themselves delta neutral. How far can they go? For 11/4 expiration the heavy calls were at 350 for SPY and 300 for QQQ. Hence we will have to see how the remainder of the week and the following week plays out knowing price levels.
Techs rule and everyone else drools.
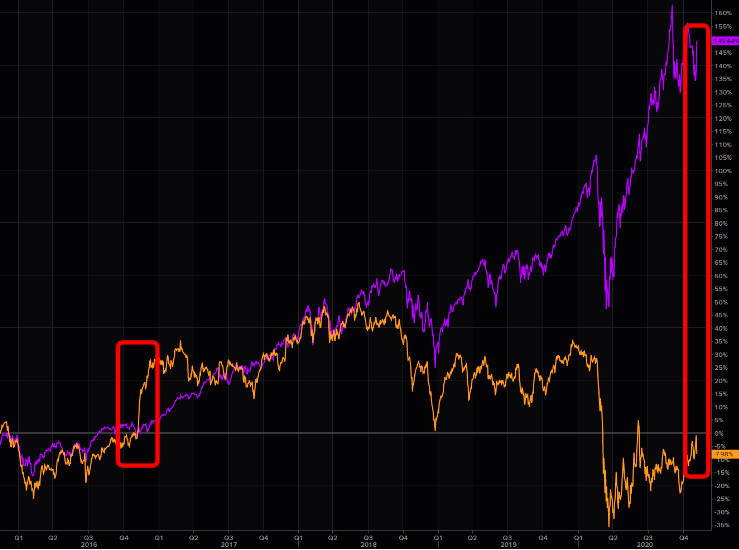
The current rise in price is mostly felt in tech stocks, FANGM, while value stocks and many others industries all though not necessary red, it was not green as extreme as the market indexes performed. The gap of advances between 2020 post election versus 2016 is much wider. Can this rally continue? Well the gap was at an all time high in early Sept. so it is in striking distance to continue.
Caution Still Warranted
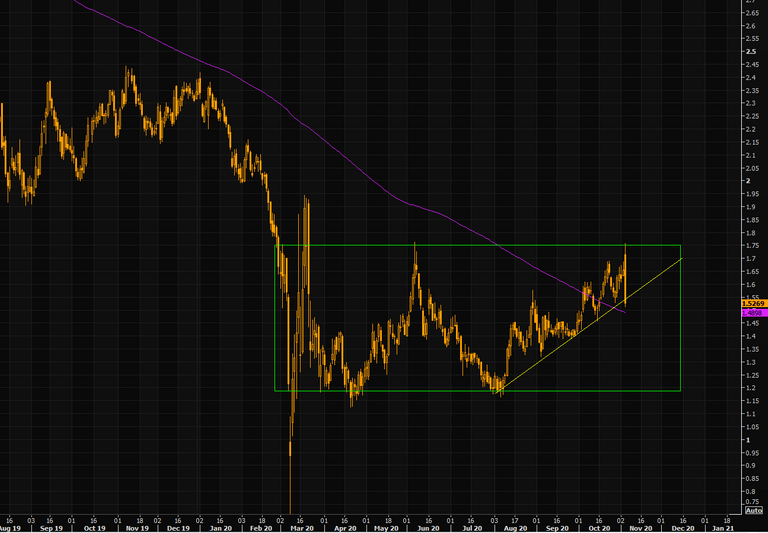
30 year US bonds yields collapsed overnight even with the recent rise in markets. What I interpret from this is likely the economy is going into a deflation cycle. The immediate drop in yields was so significant it basically took out its rise that started back in March and it happened in one day. Will rates go lower will have to be seen but there is a large retail short on bonds so I am leaning bullish on bonds.
Volatility Not Gone Yet!
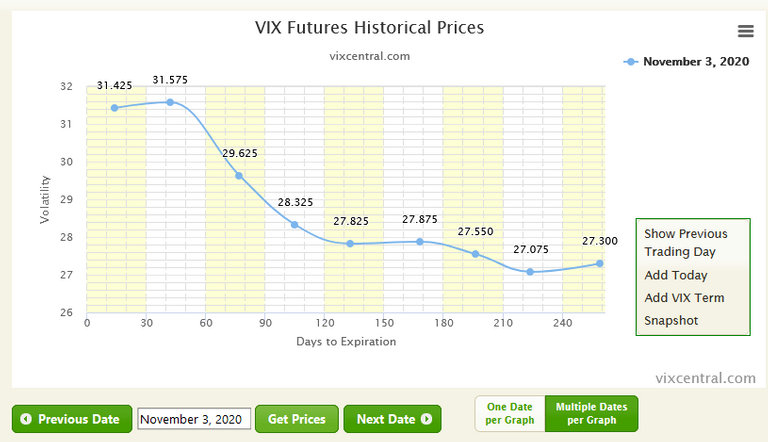
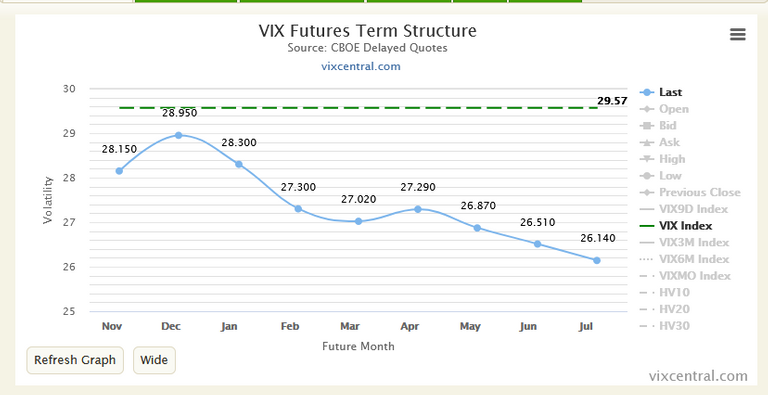
First chart is volatility curve on election day and the second chart is curve day after elections. It clearly shows that the December futures are still high. Remain cautious with the current uptrend in stocks, because it will not take much to shift the curve back to backwardation and if it does there is potential for significant pullbacks as prices have been moving up so swiftly.
Posted Using LeoFinance Beta