Building Blocks of Technical Analysis - Analysis Techniques

This week's post focuses on applying different analysis techniques to technical analysis.
Trend Analysis
To achieve success as a technical analyst, identifying the pattern is the most significant aspect. Support/resistance levels and trend line analysis are the basic techniques in this respect.
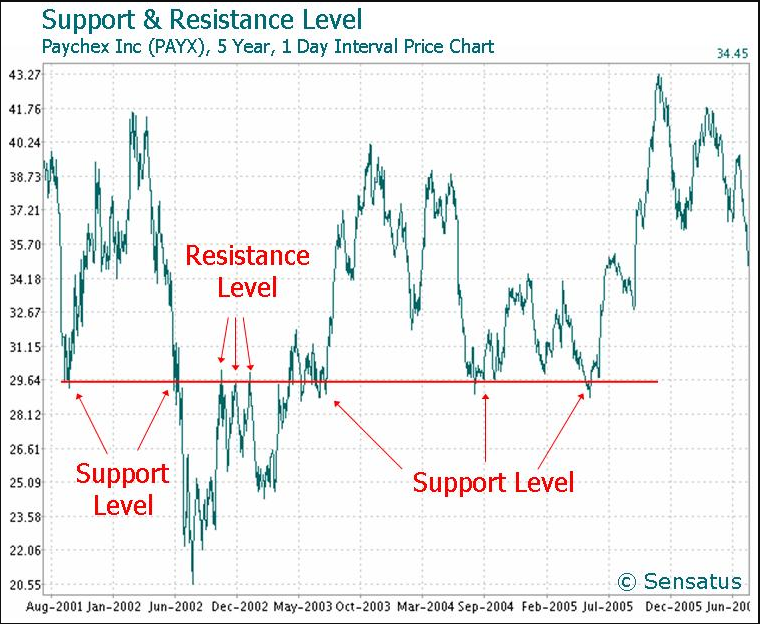
Support and resistance
A level of support is an abstract horizontal level below which the market seems reluctant to drop. Similarly, a level of resistance is a horizontal level above which the market appears unwilling to rise past.
It is helpful to explore the reasoning behind the establishment of support and resistance levels, rather than merely accepting these guidelines. This can also be extended to the psychology of trend lines and trend patterns. An underlying rationale assumption would be that market participants have a collective memory of past substantial market levels as a group. Assume that from the initial level of support, the market is going higher. In which investors are pleased but regret not having bought more, it crosses the indicated resistance line. If the price dips back to previous lows, they would be tempted to buy more. To purchase, investors and short-sellers fear they are losing out and are also hoping for a downwards move. Therefore, most market participants are in a purchasing mood around the indicated support. By overcoming selling interest, if the market reverses to the original support line buying interest, another bottom could develop by overcoming selling interest and then a support line is formed.
If the market succeeds in breaking through the resistance level, investors will be vindicated in their purchases but will continue to invest more at the previous resistance level, which now becomes a level of support. In the new funding, short and neutral place holders will also search for renewed purchase opportunities.
This illustrates the theory that help becomes resistance and vice versa on a step to similar levels and across them.
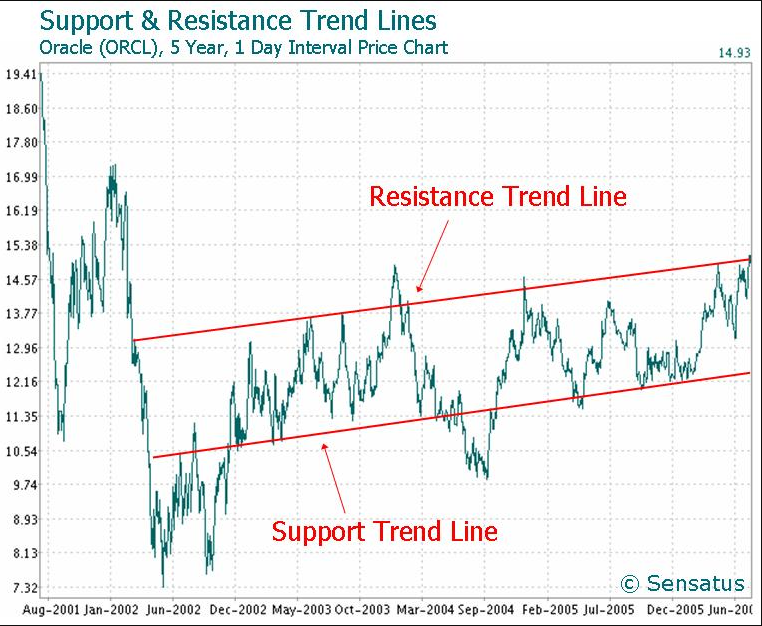
Trendlines
Definition: A straight line drawn through a succession of peaks or lows, indicating a trend.
A 'trendline' is nothing more than a line of support or resistance formed at an angle that tends to be followed by the price and can be unwilling to cross. In general, the trendline includes a series of rising lows and highs (in an increasing market) or a series of falling lows and high points (in a falling market). This implies that the market will proceed in its new path if the market crosses the trend line. These are parallel lines drawn to describe price action through a series of tops and bottoms.
Trend line growth also defines the same psychology that contributes to the development of support and resistance lines. In the example below, due to continuous excess buying interest, potential buyers have to lift their buying levels upwards along the indicated trendline.
Trendline requirements and guidelines
- To draw a preliminary trendline with a third point as proof, there must be evidence of a trend with at least two points.
- A definite violation of the trendline suggests a likely trend shift.
- Any price action should have trendlines.
- The importance of a pattern rises to the required trendlines over time.
- The steepness of trendlines leads to longevity of trends. A flat trend is a sign of short-lived weak market interest, while a very steep trend is rapidly re-pricing to ensure a balance of supply/demand.
Trendline benefits and limitations
Trendlines are simple methods for research that can be quickly implemented. However, the trend line degree can not be quantified precisely and is a subjective field of resistance or support in practice. As market action evolves, expertise is needed to change trend lines, as well as confirmation of other technical analysis methods.
Thank you for reading and hope you have a good rest of the day!
I also post my content on the following platforms:
Publish0x: https://www.publish0x.com/@aftershock9?a=Vyb82ANmev
Hive: https://hive.blog/@mercurial9
Read.cash: https://read.cash/@merurial9
Uptrennd: https://www.uptrennd.com/user/mercurial9
Steempeak: https://steempeak.com/@mercurial9
Instagram: https://www.instagram.com/minimalistpixel/
Pinterest: https://za.pinterest.com/minimalistpixel/boards/
Twitter: https://twitter.com/minimalistpixel
Posted Using LeoFinance Beta
Congratulations @mercurial9! You have completed the following achievement on the Hive blockchain and have been rewarded with new badge(s) :
You can view your badges on your board and compare yourself to others in the Ranking
If you no longer want to receive notifications, reply to this comment with the word
STOP