EN/ESP - Bitcoin Analysis for April 24th
English
What's up investor friends?
In the April 19 analysis we noted in detail that everything pointed to the BTC having lost its bullish strength and that a correction was most likely coming. This has all come to pass and BTC has fallen.
BTC first fell below the bullish channel at the price of $55K. At first I thought I saw a bearish flag pattern forming in that price zone, but then with the following candles I have realized that a bearish pennant was formed. I show you below.
4-hour candles
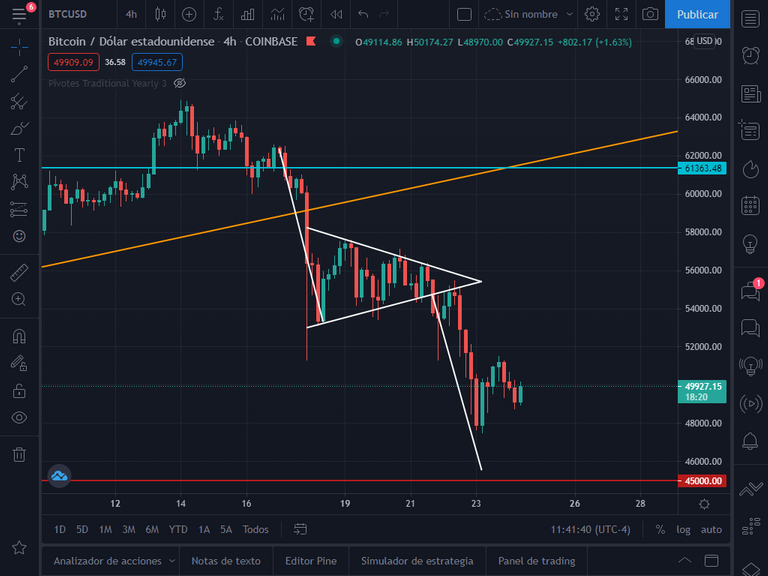
As you will see, the bears took full control in the short term, managed to break the downside pennant and quickly fall to the $48K price. The $50K support was breached and is being tested at the moment.
BTC's short-term path has turned bearish, so we should go with this current. If the $50K support does not hold, we will most likely see a rapid fall to $45K, where exactly is the target of the already broken bearish pennant.
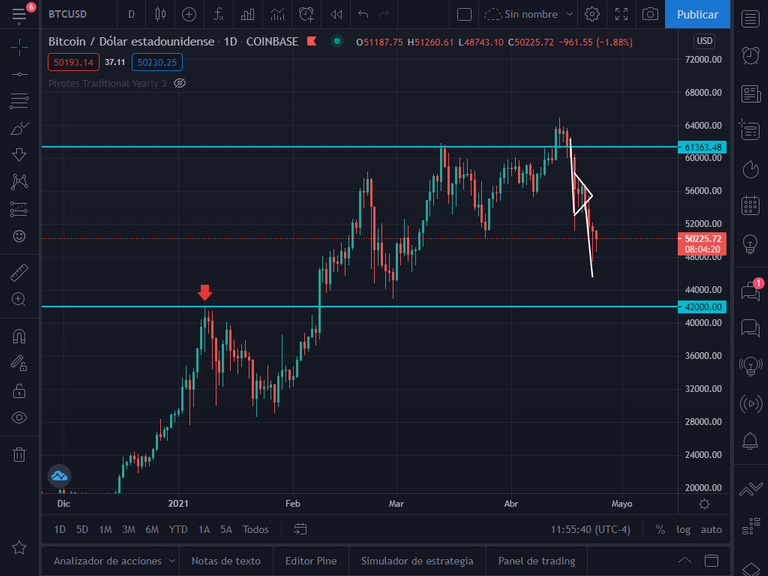
Another important support is the $42K area, there was a big bullish rejection there on January 8th, as you can see where I mark with the red arrow on the chart below.
1-day candles
Another point to note is that the $47K and $42K support zones perfectly match the .38 and .50 Fibonacci of the entire upside, so this further confirms the importance of these support zones.
1-day candles
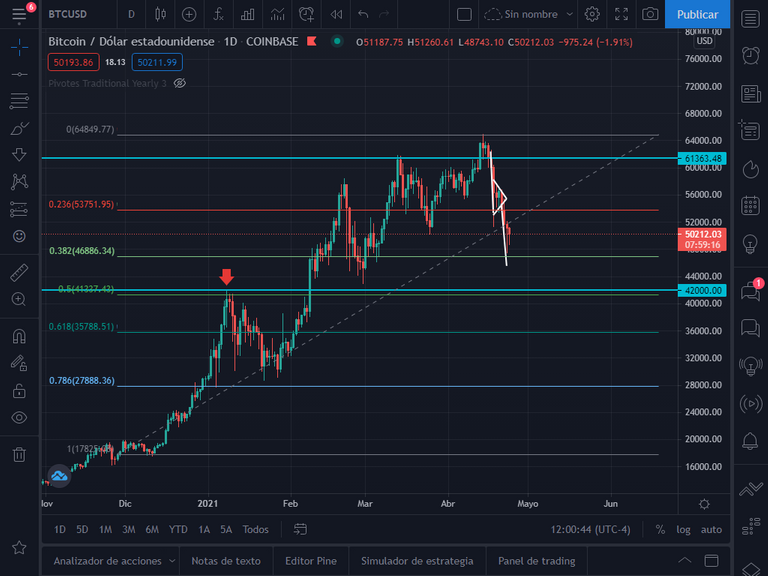
These are the support zones that I consider the most important and where we are likely to see many buyers. These are the ideal points for the BTC correction and where it could get the strength it needs to continue its long term bullish rally. In the meantime we should go with the bearish trend in the short term until we see a reversal in the price.
I hope this information is helpful to you fellow traders. Best of odds to you 💪📈.
Disclaimer
The information given in this article is only my analysis and personal opinion. Be sure to do your own analysis and research. Trading cryptocurrencies, forex, commodities, etc, is risky.

Español
¿Qué tal amigos inversores?
En el análisis del 19 de abril observamos detalladamente que todo apuntaba a que el BTC había perdido la fuerza alcista y lo mas probable era que venía una corrección inminente. Todo esto se ha cumplido y el BTC ha caído.
El BTC primeramente cayó por debajo del canal alcista al precio de 55K$. Al principio creí haber visto un patrón de bandera bajista formándose en esa zona de precio, pero luego con las siguientes velas me he dado cuenta de que se formó un banderín bajista. Les muestro a continuación.
Velas de 4 horas
Como verán, los osos tomaron el total control en el corto plazo, lograron romper el banderín a la baja y caer rápidamente hasta el precio de 48K$. El soporte de 50K$ fue sobrepasado y está siendo probado en este momento.
El camino del BTC en el corto plazo ha cambiado bajista, así que debemos ir a favor de esta corriente. Si el soporte de 50K$ no resiste, muy probablemente veremos una caída rápida hasta los 45K$, donde exactamente está el objetivo del banderín bajista ya roto.
Otro soporte importante es la zona de 42K$, allí hubo un gran rechazo alcista el 8 de enero, como pueden observar donde marco con la flecha roja en el grafico a continuación.
Velas de 1 día
Otro punto a destacar es que las zonas de soporte de 47K$ y 42K$ calzan perfectamente con el .38 y .50 Fibonacci de toda el alza, por lo que esto nos confirma aún mas la importancia de estas zonas de soporte.
Velas de 1 día
Estás son las zonas de soporte que considero mas importantes y en donde probablemente podamos ver muchos compradores. Estos puntos son los ideales para la corrección del BTC y donde podría tomar la fuerza que necesita para continuar con su rally alcista a largo plazo. Mientras tanto debemos ir a favor de la tendencia bajista en el corto plazo hasta ver una reversión en el precio.
Espero esta información les sea de utilidad amigos traders. Las mejores de las probabilidades para ustedes 💪📈.
Descargo de responsabilidad
La información que se ofrece en este artículo es sólo mi análisis y opinión personal. Asegúrese de hacer su propio análisis e investigación. Operar con criptomonedas, divisas, materias primas, etc, es arriesgado.
Posted Using LeoFinance Beta
Congratulations @theanalystjohn! You have completed the following achievement on the Hive blockchain and have been rewarded with new badge(s) :
Your next payout target is 100 HP.
The unit is Hive Power equivalent because your rewards can be split into HP and HBD
You can view your badges on your board and compare yourself to others in the Ranking
If you no longer want to receive notifications, reply to this comment with the word
STOPSupport the HiveBuzz project. Vote for our proposal!
El retroceso Fibo yo lo tehgo trazado desde 10135$ (Coinbase). Creo que es donde inicio el mercado alcista despues de un impulso a la baja que finalizo con un fallo en 5ª.
Fijate como coincide el 23,6% en el primer latigazo a la baja y como coincide la proyeccion 100% para la onda C con el 38,2% tal cual trazo Fibo.
...Y ese triangulo yo creia que venia con trampa y me lo comi como si fuera un delicioso canal 🤣🤣🤣🤣🤣
Coinciden perfectamente, el Fibonacci está presente siempre. Intenta trazarlo desde diferentes puntos y veras que siempre los puntos coinciden con algún movimiento en el precio. Yo lo he trazado desde el punto que he mostrado porque justo allí se dio el movimiento que rompió los 20K$. Creo que el próximo movimiento del BTC será a los 45K$ y 42K$, sobre todo ese soporte de 42K$ es el mas importante.
They coincide perfectly, the Fibonacci is always present. Try to plot it from different points and you will see that the points always coincide with some movement in the price. I have plotted it from the point I have shown because right there was the move that broke $20K. I think the next BTC move will be to $45K and $42K, especially that $42K support is the most important.
Posted Using LeoFinance Beta