Bitcoin chart analysis 2020. 09. 17
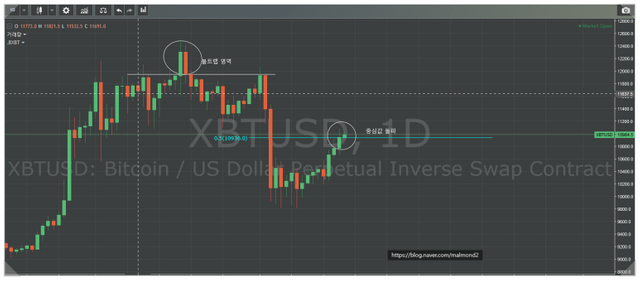
1 day chart
Breaking through the center value of the dark bar posted the day before
See if the next sale, $11,400, will be the target
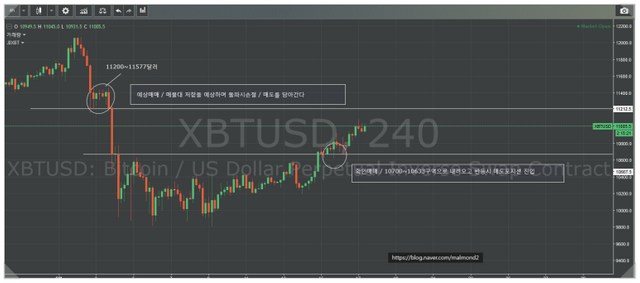
4 hour chart
You can try the selling position by predicting and confirming trading.
It seems that the stop loss line must be clear to enter the buy or sell position at the current market price.
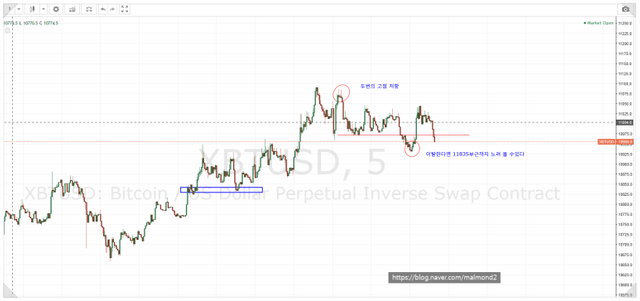
5-minute chart
Short-term support break after two highs resistance
If you deviate from the pressed section, you can gaze up to around 11835.
Wait for volatility on the day when the 18th option expiration date and the futures expiration date overlap
Please make your own decision to buy or sell. You are responsible for all trading.
Posted Using LeoFinance
0
0
0.000
0 comments