Twitter just had its saddest day
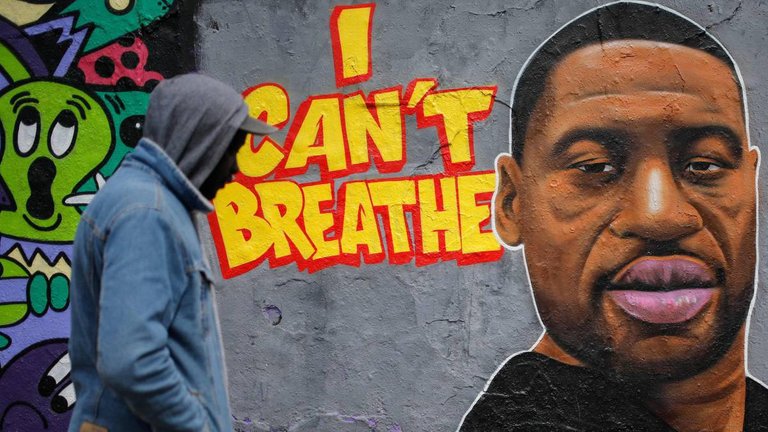
Violent protests are going on at present in the United States after the death of George Floyd. George, an African-American man, died due to racial attack by a police officer on 25th May, 2020. Soon a video recording, showing the arrested George saying "Please...I can't breathe...Don't kill me", was widely circulated in the social media. The protests started immediately. Initially it was peaceful but then the police cars were set ablaze, stores were looted and destruction of public property took place. Things are going worse only now. At least 25 cities in the US are under curfew and the protest has turned into a violent rage. The social media is being flooded with numerous video footages of the protest, damage, clashes and mass looting. While Trump is blaming the radical group ‘Antifa’ for the riots, the opposition parties are blaming the government for its failure to control law and order situation. The United States is most probably observing its biggest internal social crisis and civil unrest of the decade.
Nowadays Twitter is an extremely popular social media to express ourselves. We articulate our thoughts through 280 character limited tweets. The scientists of the University of Vermont are tracking twitter sentiment since 2009 with the help of their ‘Hedonometer’. It is an analytical software to capture twitter sentiments in an intelligent manner. It also depicts different types of charts to discover different facets of the human emotion contained in tweets. Hedonometer is the ‘Dow Jones Index of Happiness’. Yesterday Hedonometer captured Twitter’s saddest day in the history. It is related to the present incidents in the US. Twitter is extremely popular in the US and the incidents over there influence twitter global trends dramatically. The last saddest day occurred on 30th March, 2020 due to the reason of the coronavirus epidemic.
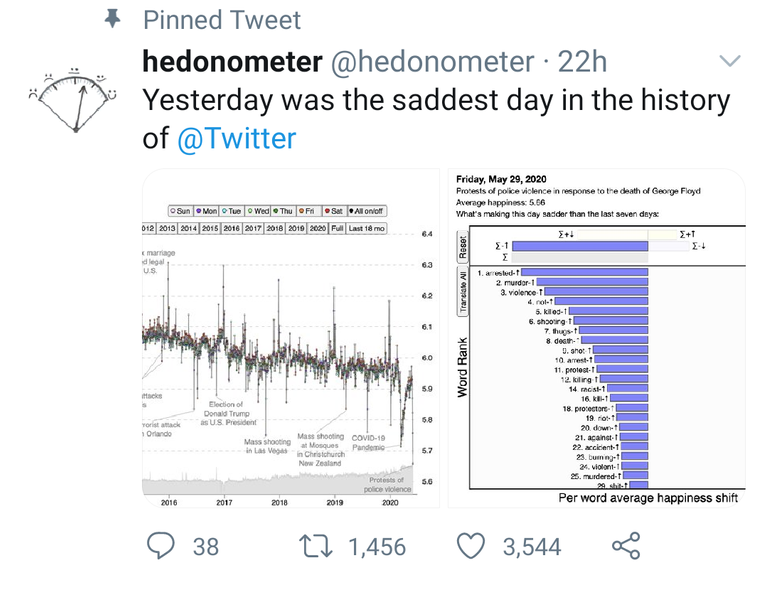
Official tweet of Hedonometer
Hedonometer uses an algorithm to randomly scan roughly 10% of all global tweets (mostly English) and tracks the most frequently used words after eliminating the fillers. It maps the frequent words on a scale to derive a happiness chart. The charts is a depiction of our happiness or sorrow. Hedonometer is obviously a very experimental project but it is a good tool to analyze social media behaviour. Hedonometer uses a scale of 10 to measure happiness. The lower scale is for sorrow and the higher scale is for happiness. The average happiness was 5.66 on 29th May, 2020. It is the lowest in the history of Twitter. People aggressively tweeted with the keywords like “death, thugs, arrested, killing, murder, violence” etc.
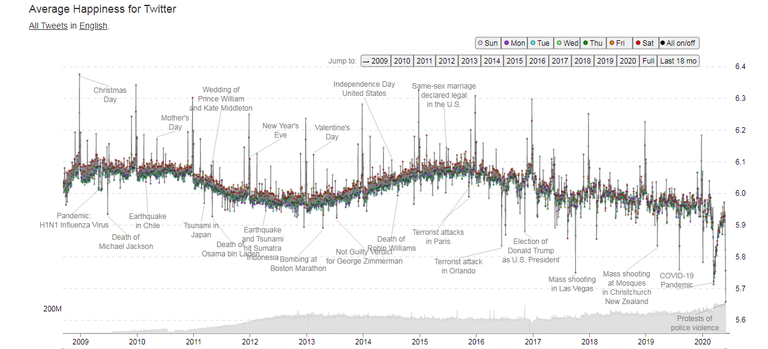
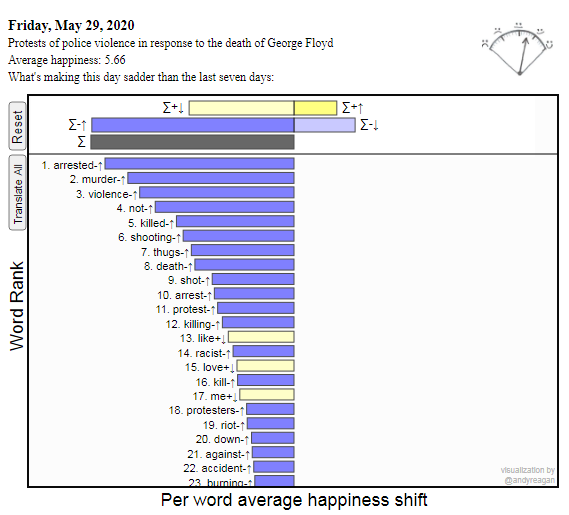
Image Source – Hedonometer website
People are sad. People are angry too. Is anger and sadness correlated? Difficult to say! But generally an angry person is not happy. Twitter psychoanalysis shows that people are feeling negative. The mental state of depression is visible. Hope things become normal soon. Such an extent of people’s rage can be self-defeating. Our mood plays a role when we evaluate a situation, person or an event. A happy mind often tends to collect the right information and a sad state of mind tends to do vice versa. Happy people often evaluate others in a positive way. The positive evaluation is correlated to the positive mood. Bias occurs by default often we deviate from the happiness. Most probably it is time to change the mood to process information accurately. Sounds difficult? Hmm, often we can’t control our mind but the bigger cause of peace and harmony needs some extra efforts. The change must originate from our mind. Let’s try.
Cheers!
[paragism]
#posh
https://twitter.com/paragism/status/1267117754227843074?s=19
I am so ashamed that this happened this was not supposed to happen and he was not the first that got killed , i hope there will be justice if that it’s even possible
I am seeing numerous terrible video footages of violence now. The situation is out of control. Are you from the US?
Nope didn’t you know that I live in the Netherlands ?
Oh yes...I forgot
But also that happens in holland unfortunately and i hate it, its so disgusting
Dear @paragism
Unfortunatelly, it seem that each time peaceful protests are happening - it attract also wrong kind of people. Who just want to release their anger.
It's definetly sad time for many :(
I never knew such a thing existed
Yours, Piotr
I came to know from their tweet only
Yeah, in most parts of the world peaceful protest are usually hijacked by other individuals. And it’s difficult to control a protest that involves a huge amount of people.
I remember the Catalan protests last year, where individuals converged in Barcelona's city center. There was literally no other activity in the city that period. Roads were blocked and all.
I think the US government have to listen to what the protesters are saying and follow due process by charging the accused.
I agree with you that the mood out there is generally negative. If we don't quickly open up, things may get out of hand in other parts of the world. Thanks for sharing.
Peace should prevail. Yes, it may spread to other parts of the world.
The world is demanding justice for tbis cruel act done on Floyd. He does not deserve to die
Obviously ...but let's wish peaceful protest.
Maybe it is the other way round - sadness turns into anger - seen it on the news - things are really escalating over there 😔
Yes quite dangerous
It is all very crazy. It is also sad that we are still having to deal with stuff like this in the day and age in which we live. You would think that people could learn to be a bit more accepting and less judgmental. I had never heard of this meter before. It is interesting but also very telling that this is the thing that prompted the saddest day. We need to learn from that and grow together.
Yes, the collective psychoanalysis shows that we are depressed. Most probably it is right time to bring peace.