Technical Analysis 101 - Moving Average and MACD
Welcome to my weekly series, where I share what I have learned about technical analysis and attempt help us make better trading decisions. This week, we are going to be looking at the moving average and MACD indicators and what they can tell us. The tools we have looked at in the past overlay the chart data, however indicators use algorithms to interpret the data in different ways to provide useful information.
Moving Average
Moving average is a calculation used to analyze data points by creating a series of averages of different subsets of the full data set. Moving average is an indicator commonly used in technical analysis and helps smooth out the price data by creating a constantly updated average price and mitigates the impacts of random, short term fluctuations on the price over the specified time frame.
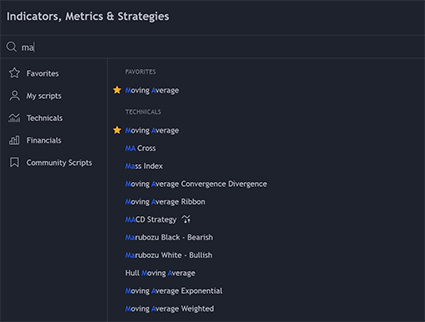

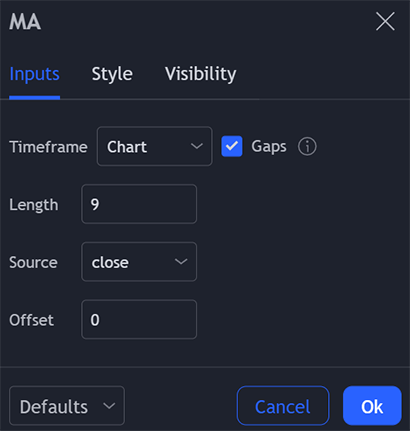
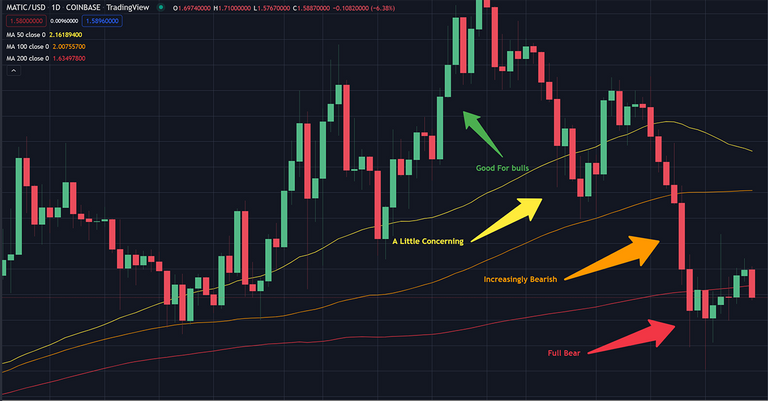
Often traders will use 2, 3 or more moving averages to form a range that the price may respond to. 50, 100 and 200 are commonly used values, though other combinations are also used. This is a bit simplified but essentially in a bull market the price should be staying above to 50 moving average with only brief dips below the line. Breaking below the 50 MA is a bit concerning but if it manages to stay above the 100 MA then most traders will expect it is just a matter of time to return to bull. The price breaking below the 100 MA and not swiftly rebounding is an increasingly bearish signal at this point traders will start to take notice, which can also have the effect of pushing the price down further. The 200 MA is the last break before full bear market if the price breaks below the 200 and doesn't quickly recover, then there is likely more downward movement to come. The same applies in reverse as the price rises after a bear market as well. Traders will also look for moving average crossovers, this is where the line from one moving average crosses over another one and can be seen as a bullish or bearish signal depending on the line and direction of the cross. The general rule is that shorter time frames passing above longer one is considered a bullish signal while the opposite would signal bearish. Does a crossover always lead to a major shift in the price action, no but trader will certainly want to be paying attention when one occurs.
MACD
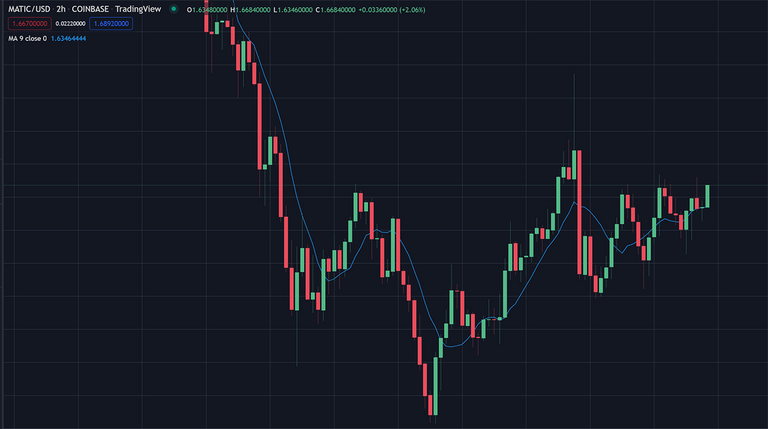
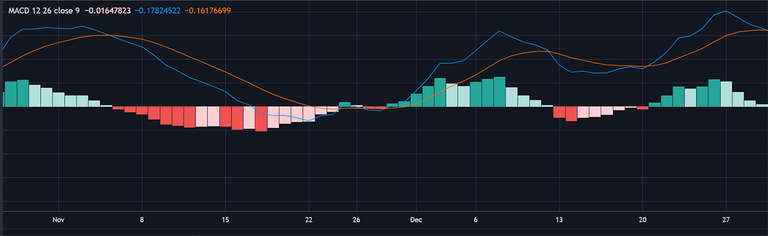
Moving average convergence or MACD is a trend-following momentum indicator that shows the relationship between two moving averages. The MACD line is calculated by subtracting the 26 period exponential moving average from the 12 period EMA. A nine period EMA of the MACD called the 'signal line,' is then plotted on top of the MACD line, which can function as a trigger for buy and sell signals. Traders may consider it a buy signal when the MACD crosses above the signal line and a sell or short signal if the MACD cross below the signal line. The green and red bars are an indicator how far positive or negative the lines are from each other and is used by traders to gauge the strength of the current trend, further apart is an indicator the trend is likely to continue for the short term, closer together signals the trend is weakening and may shift soon. To keep things simple you could just buy when the there is a buy signal and sell when there is a sell signal but this would not get optimal results. Sometimes the MACD can cross back and forth in quick succession if you were following a simple buy and sell strategy you would likely come out loosing money when these occur. We can also draw trendlines with MACD just like we would with price action and then watch for it to break outside the trendlines than can signal shifts in the movement. Also watch for divergence in the price movement, what is meant by this is if the MACD keeps hitting lower lows or higher high but the price is still moving somewhat sideways this can indicate a price movement is imminent, essential it is a signal of changing momentum that isn't reflected in the market yet.

okay well this should have helped explain how the moving average and MACD indicators can aid in figuring out how the price action is moving. These indicators are more to confirm the strength and direction of the movement and should not be used as strict buy and sell signals, however when you used correctly you can gain insight into what is coming before it hits the market.
Previous Articles in this series
| Technical Analysis 101 Issue 3 - Patterns and Trends | Technical Analysis 101 Issue 2- Trading View |
| Technical Analysis 101 Issue 1- Exchanges |

Join the Cartel

https://twitter.com/UnlikelySurviv1/status/1487980202596581380
The rewards earned on this comment will go directly to the person sharing the post on Twitter as long as they are registered with @poshtoken. Sign up at https://hiveposh.com.