Cardinals at Reds Predictions and Preview for 7/24/2021
The St. Louis Cardinals visit the Cincinnati Reds on 7/24/2021 at 7:10PM.
The Cardinals and the Reds face off in an regular season game. The Cardinals have a record of 49-49 this season. The Reds are 50-47 this season.
Starting Pitcher and Lineup for the St. Louis Cardinals
Our friends over at YouWager have the best Moneyline Cincinnati Reds -173. If you are a new player, they will match your deposit 50%… pretty doggone good.
Jake Woodford is 2-1 this season with an ERA of 4.06 in 31.0 innings pitched across 1 starts. He has a WHIP of 1.39 and yields an opponent Batting Average of 0.246. Jake Woodford’s pitching repertoire includes:
- A Fastball that is on average 92.1 mph.
- A Slider that is on average 82.9 mph.
- A Curveball that is on average 76.6 mph.
- A Changeup that is on average 85.1 mph.
Here is a breakdown of the type of contacted balls Jake Woodford has attracted this season:
- Ground Ball Rate: 45.1%
- Fly Ball Rate: 29.7%
- Line Drive Rate: 25.3%
He has attracted the following types of contact velocities:
- Soft Hit Ball Rate: 16.5%
- Medium Hit Ball Rate: 49.5%
- Hard Hit Ball Rate: 34.1%
Tyler O’Neill
Tyler O’Neill has hit 16 Home Runs, drove in 38 runs, and sports a .270 batting average this season. He also has scored 40 runs this season and stolen 8 bases.
He has an OPS that is above-average. Tyler O’Neill would be considered a power hitter this season, although he is not one of the top pure power hitters.
He is below average with his 5.2% walk rate, drawing walks may not necessarily be that important or the opportunity may not arise as much. Striking out a bit more than your average hitter with a K Rate of 31.0%, it is not ideal, but… still a weakness. This season, he has been an above-average player at getting on base.
Breaking down the types of contacted balls Tyler O’Neill put into play this season:
- Ground Ball Rate: 32.4%
- Fly Ball Rate: 40.3%
- Line Drive Rate: 27.3%
Now here is a breakdown of the velocity of the balls he put into play:
- Soft Hit Ball Rate: 15.9%
- Medium Hit Ball Rate: 43.2%
- Hard Hit Ball Rate: 40.9%
Paul Goldschmidt
Paul Goldschmidt has hit 17 Home Runs, drove in 55 runs, and sports a .272 batting average this season. He also has scored 53 runs this season and stolen 6 bases.
He has an OPS that is above-average. He hits with above-average power and it must be respected.
He is an above average hitter when came to his ability to draw walks with a 9.5% walk rate. He has a K Rate of 20.7% this season, which is a bit lower than your average MLB hitter. This season, he has been an above-average player at getting on base.
Breaking down the types of contacted balls Paul Goldschmidt put into play this season:
- Ground Ball Rate: 38.0%
- Fly Ball Rate: 39.8%
- Line Drive Rate: 22.2%
Now here is a breakdown of the velocity of the balls he put into play:
- Soft Hit Ball Rate: 12.7%
- Medium Hit Ball Rate: 45.4%
- Hard Hit Ball Rate: 41.9%
Harrison Bader
Harrison Bader has hit 7 Home Runs, drove in 20 runs, and sports a .276 batting average this season. He also has scored 17 runs this season and stolen 5 bases.
He has an OPS that is above-average. He hits with above-average power and it must be respected.
He is an above average hitter when came to his ability to draw walks with a 9.3% walk rate. He has a K Rate of 16.0% this season, which is a bit lower than your average MLB hitter. This season, he has been an above-average player at getting on base.
Breaking down the types of contacted balls Harrison Bader put into play this season:
- Ground Ball Rate: 42.3%
- Fly Ball Rate: 41.4%
- Line Drive Rate: 16.2%
Now here is a breakdown of the velocity of the balls he put into play:
- Soft Hit Ball Rate: 23.4%
- Medium Hit Ball Rate: 45.0%
- Hard Hit Ball Rate: 31.5%
Nolan Arenado
Nolan Arenado has hit 19 Home Runs, drove in 59 runs, and sports a .258 batting average this season. He also has scored 45 runs this season and stolen 1 bases.
He has an OPS that is above-average. Nolan Arenado would be considered a power hitter this season, although he is not one of the top pure power hitters.
He is an above average hitter when came to his ability to draw walks with a 7.0% walk rate. He has a K Rate of 13.3% this season, which is a bit lower than your average MLB hitter. This season, he has been an above-average player at getting on base.
Breaking down the types of contacted balls Nolan Arenado put into play this season:
- Ground Ball Rate: 30.8%
- Fly Ball Rate: 50.5%
- Line Drive Rate: 18.7%
Now here is a breakdown of the velocity of the balls he put into play:
- Soft Hit Ball Rate: 18.4%
- Medium Hit Ball Rate: 50.2%
- Hard Hit Ball Rate: 31.4%
Starting Pitcher and Lineup for the Cincinnati Reds
Luis Castillo is 3-10 this season with an ERA of 4.39 in 108.2 innings pitched across 20 starts. He has a WHIP of 1.41 and yields an opponent Batting Average of 0.249. Luis Castillo’s pitching repertoire includes:
- A Fastball that is on average 97.1 mph.
- A Slider that is on average 85.9 mph.
- A Changeup that is on average 87.9 mph.
Luis Castillo has shown a penchant for forcing hitters to hit ground balls. In fact, 52.9% of balls in play were on the ground. Does this mean he is attracting soft contact though? Those ground balls are getting up the middle and through the 5 1/2 hole for hits, but his infield is also putting in work to getting to the balls too.
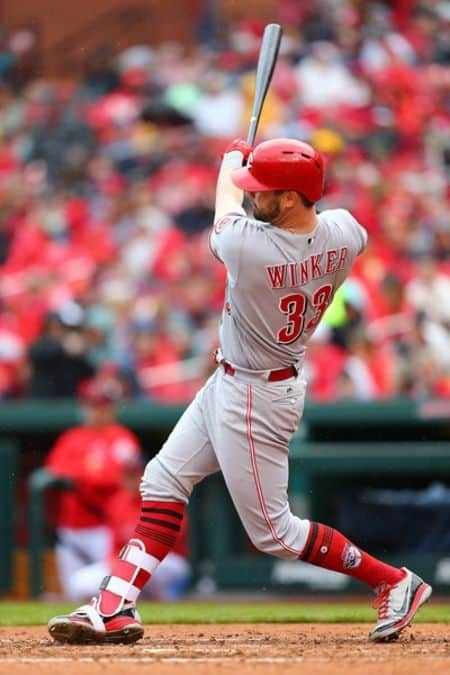
Jesse Winker
Jesse Winker has hit 19 Home Runs, drove in 52 runs, and sports a .291 batting average this season. He also has scored 61 runs this season and stolen 1 bases.
He is considered a very good hitter according to OPS. .888 is his OPS this season, can it go higher?Jesse Winker would be considered a power hitter this season, although he is not one of the top pure power hitters.
He is an above average hitter when came to his ability to draw walks with a 9.6% walk rate. He has a K Rate of 17.3% this season, which is a bit lower than your average MLB hitter. This season, he has been an above-average player at getting on base.
Breaking down the types of contacted balls Jesse Winker put into play this season:
- Ground Ball Rate: 43.3%
- Fly Ball Rate: 33.0%
- Line Drive Rate: 23.8%
Now here is a breakdown of the velocity of the balls he put into play:
- Soft Hit Ball Rate: 14.9%
- Medium Hit Ball Rate: 49.3%
- Hard Hit Ball Rate: 35.8%
Jonathan India
Jonathan India has hit 8 Home Runs, drove in 38 runs, and sports a .276 batting average this season. He also has scored 48 runs this season and stolen 7 bases.
He has an OPS that is above-average. He hits with above-average power and it must be respected.
His ability to draw walks is quite good. He is a selective hitter sporting a 13.4% walk rate. He has a K Rate of 22.3% this season, which is a bit lower than your average MLB hitter. Getting on base is not an issue for Jonathan India this season.
Breaking down the types of contacted balls Jonathan India put into play this season:
- Ground Ball Rate: 50.0%
- Fly Ball Rate: 30.3%
- Line Drive Rate: 19.7%
Now here is a breakdown of the velocity of the balls he put into play:
- Soft Hit Ball Rate: 18.2%
- Medium Hit Ball Rate: 49.8%
- Hard Hit Ball Rate: 32.1%
Joey Votto
Joey Votto has hit 12 Home Runs, drove in 44 runs, and sports a .266 batting average this season. He also has scored 30 runs this season and stolen 1 bases.
He has an OPS that is above-average. He hits with above-average power and it must be respected.
He is an above average hitter when came to his ability to draw walks with a 11.8% walk rate. He has a K Rate of 23.6% this season, which is a bit lower than your average MLB hitter. This season, he has been an above-average player at getting on base.
Breaking down the types of contacted balls Joey Votto put into play this season:
- Ground Ball Rate: 39.9%
- Fly Ball Rate: 33.7%
- Line Drive Rate: 26.4%
Now here is a breakdown of the velocity of the balls he put into play:
- Soft Hit Ball Rate: 6.7%
- Medium Hit Ball Rate: 51.7%
- Hard Hit Ball Rate: 41.6%
Tucker Barnhart
Tucker Barnhart has hit 4 Home Runs, drove in 29 runs, and sports a .271 batting average this season. He also has scored 31 runs this season and stolen 0 bases.
He has an OPS that is above-average. He hits with above-average power and it must be respected.
He is an above average hitter when came to his ability to draw walks with a 9.0% walk rate. Striking out a bit more than your average hitter with a K Rate of 28.6%, it is not ideal, but… still a weakness. This season, he has been an above-average player at getting on base.
Breaking down the types of contacted balls Tucker Barnhart put into play this season:
- Ground Ball Rate: 42.5%
- Fly Ball Rate: 28.1%
- Line Drive Rate: 29.5%
Now here is a breakdown of the velocity of the balls he put into play:
- Soft Hit Ball Rate: 8.7%
- Medium Hit Ball Rate: 56.4%
- Hard Hit Ball Rate: 34.9%
St. Louis Cardinals vs. Cincinnati Reds Prediction, Picks, and Odds
Prediction: Cardinals 0 Reds 4
Moneyline Pick: Cincinnati Reds -173 YouWager
Under Pick: Under 9.5 -113 BetOnline Get Up to a Grand in Your Hand Now!