S&P 500: Don't Get Too Comfortable, A Meltdown Could Occur At Any Moment by Victor Dergunov
Summary
- The S&P 500 is up by 30% in under 1 year, since its December 2018 bottom.
- However, the technical image is starting to look overextended. Also, the VIX divergence is very troubling.
- The "Fed Put" appears to be off the table, and the economy as well as the stock market may begin to stall once again.
- Many key economic indicators appear to be changing rapidly from month to month, underlining the fragile, and unstable state of the U.S. economy.
- There are multiple other factors that suggest the S&P 500 and stocks in general are at or are near a top. Please read on to find out more.
- This idea was discussed in more depth with members of my private investing community, Albright Investment Group . Get started today
Source: CSMonitor.com
Don’t Get Too Comfortable, A Meltdown Could Occur at Any Moment
The S&P 500 (SP500)/SPX is trading at/or near new all-time highs. In fact, the SPX has surged by a whopping 30% since my “A Significant Rally Could Be Approaching” article was written back on December 24, 2018. Nevertheless, despite the meteoric rise, cracks continue to form in the economic foundation and a significant correction, a mini-meltdown, or even a bear market could occur at any moment.
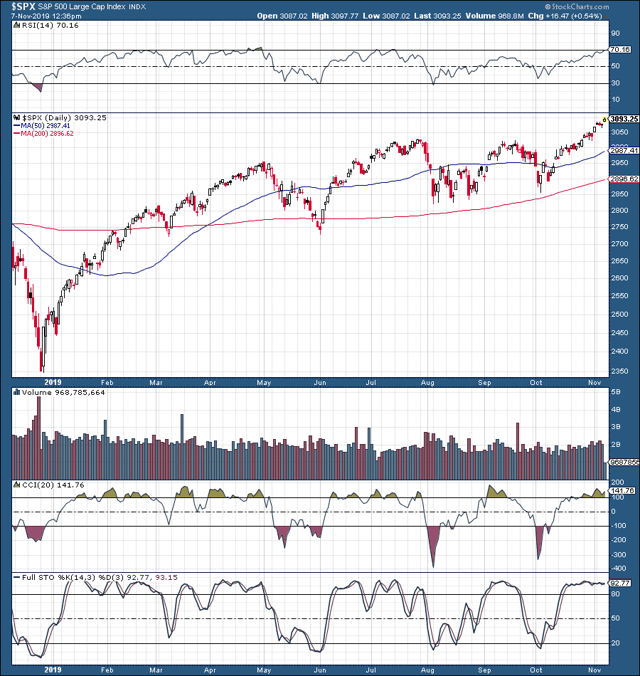
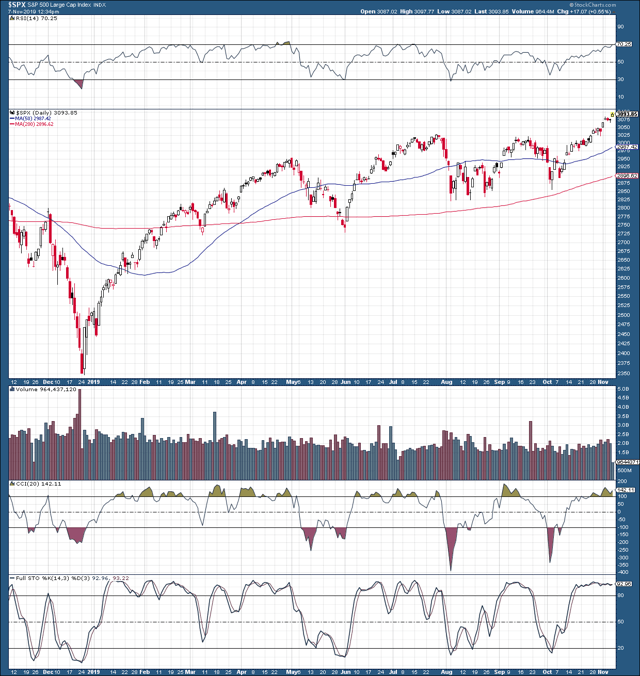
Source: StockCharts.com
On February 24, I published an article, “Why Stocks Are Going Higher From Here”. This was when the SPX was at around 2,800, roughly 9% below where it is today. Back then, I used a price target of around 3,200 at which the market could top out. However, given the troubling and inconsistent economic landscape, the correction is likely to arrive sooner than I had anticipated. Furthermore, to exacerbate the situation, the Fed put appears to be back off the table, at least for now.
There are many troubling factors that suggest we may be at or near a top in the S&P 500 and stocks in general. Please read on to find out why.
The S&P 500: Overbought and Overextended
Let’s begin by examining the technical image pertaining to the S&P 500. Despite a plethora of negative news flow, and a substantial number of uncertainties, the SPX has been in a sustainable uptrend for nearly a year now.
S&P 500 1-Year Chart
The RSI is at 70, indicating the likelihood of overbought conditions materializing in the near future. Moreover, other key technical indicators such as the CCI, full stochastic, and others are painting a similar image, akin to a market that is becoming overheated, and is likely to experience a change towards negative momentum soon.
If we are not at a top now, it is possible that this bull stampede could elevate the SPX towards the 3,100-3,150, but I would likely view this as an opportunity to reduce positions, hedge, increase cash holdings, and possibly even short the market.
The VIX Divergence: A Very Troubling Phenomenon
One troubling phenomenon I want to draw your attention to is the VIX, and the apparent divergence we are witnessing in relation to the SPX. Typically, the VIX and the SPX are supposed to move in opposite directions.
VIX 1-Year Chart
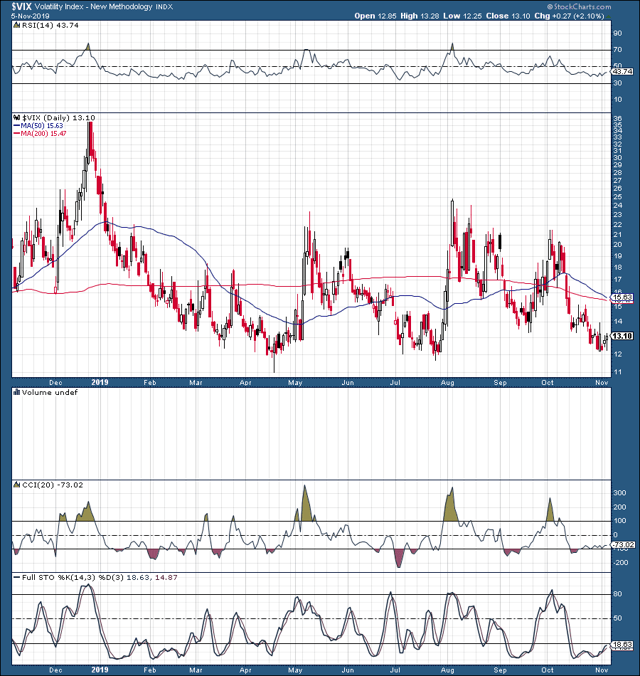
As the market/SPX moves higher and makes new highs, the VIX is supposed to move lower or remain at a subdued level. We are not seeing this now. In fact, as the SPX sits at/or near new all-time highs, the VIX is nowhere near its all-time lows.
The VIX closed out the session on Tuesday at 13.10, notably higher than the 12 level we saw just days ago (when the SPX was lower as well), and substantially lower than where we saw the VIX in 2017/early 2018, when it traded below 10, or even 9 at some points.
...Read the Full Post On Seeking Alpha
Author Bio:

Steem Account: @victordergunov
Seeking Alpha Account: Victor Dergunov
Twitter Account: @victordergunov
Steem Account Status: Unclaimed
Are you Victor Dergunov? If so, you have a Steem account that is unclaimed with pending cryptocurrency rewards sitting in it from your content. Your account was reserved by the Steemleo team and is receiving the rewards of all posts syndicated from your content on other sites.
If you want to claim this account and the rewards that it has been collecting, please contact the Steemleo team via twitter or discord to claim the account. You can also view the rewards currently sitting in the account by visiting the wallet page for this account.
What is Steemleo Content Syndication?

The Steemleo community is syndicating high-quality financial content from across the internet. We're also creating free Steem accounts for the authors of that content who have not yet discovered the Steem blockchain as a means to monetizing their content and we're listing those accounts as the 100% beneficiaries to all the rewards. If you want to learn more about Steemleo's content syndication strategy, click here.
Totally agree, with the VIX at 12, a pop is inevitable, which should cause the equity markets to at least correct.
Very good use of technical indicators, a good learning one for sure.
So there is a resistance creation is on the way and if so, then where is the support in long term
A good post but it has 11 days of age now
I don't trust of these levels on the S&P 500